The Indian stock market has become a national conversation. Retired pensioners, mutual-fund salesmen and Uber drivers all seem to be asking the same question: if the economy is growing at 7.8%, why has the Nifty fallen almost 11% since late February while markets in the US, Japan and Korea have risen?
Market performance is always relative. Indian shares compete not only with their own history, but with every other place investors can put their money. That is why the GDP headline is not enough: India’s reversal only makes sense against the changing global opportunity set.
My answer is that four pressures arrived together. Indian valuations had run hot. Rising global rates raised the hurdle for every equity market. AI, chips and cloud infrastructure opened up fresh earnings growth elsewhere. And the Middle East crisis squeezed India through dearer oil and a weaker rupee.
The larger issue is not one bad spell in the market. It is whether India is placing the bets that will sustain growth when energy remains vulnerable to distant wars, capital is no longer cheap and the defining technologies of the era are being monetised elsewhere. The test is whether the country can turn its human capital into listed profits and durable wealth, rather than another burst of headline growth.
A falling market cannot answer those questions. It can, however, warn that investors are starting to ask them.
Indian growth needs to earn its remaining equity premium
The obvious objection is that the market has already corrected. It has—partly. The Nifty now trades at about 19 times trailing earnings, below its recent range, and its earnings yield has climbed to 5.21%. Equities still yield less than Indian government bonds, but the gap has narrowed from roughly 2.2 percentage points in 2025 to about 1.9. Calling Indian stocks wildly overpriced is no longer fair.
But cheaper is not the same as cheap. A lower price helps only if the companies behind it can grow into the valuation. This is where the GDP headline misleads: 7.8% describes the economy; the Nifty represents fifty listed companies. Shareholders are paid from those companies’ profits, not from the growth happening around them.
The question, then, is whether India Inc. can deliver enough earnings growth to justify the price—especially for foreign investors, who also carry the rupee risk. Recent profits have been less dependable, while money that once came to India almost by default now has credible alternatives: a Treasury bond with a decent yield, or a Korean chipmaker riding the AI build-out.
I am not calling a crash, or telling anyone to swap every stock for a bond. My point is narrower: India can no longer be bought simply because it is India. The case has to be earned company by company. Faster profit growth, cheaper oil, a steadier rupee or more listed businesses with genuine AI exposure would change the picture. Until then, selectivity matters more than faith in the headline.
India underperformed markets that absorbed the same global rate shock
Start with the scoreboard. From late February to the start of October, the Nifty fell almost 11%. Over the same stretch, the S&P 500 gained more than 11%, while Japan and Korea also rose. China fell and Europe went roughly nowhere. This was not a global sell-off that happened to catch India; something specific to India—or to how investors now price it—was at work.
Table 1 — How India stacked up against other markets
| Benchmark | 27 Feb 2026 | 1 Oct 2026 | Price return | Gap vs India (percentage points) |
|---|---|---|---|---|
| India Nifty 50 | 25,178.65 | 22,421.95 | −10.95% | 0.00 |
| US S&P 500 | 6,878.88 | 7,666.48 | +11.45% | +22.40 |
| US Nasdaq | 22,668.21 | 26,871.60 | +18.54% | +29.49 |
| Japan Nikkei 225 | 58,850.27 | 68,956.72 | +17.17% | +28.12 |
| South Korea KOSPI | 6,244.13 | 6,971.35 | +11.65% | +22.60 |
| Europe STOXX 600 | 633.85 | 626.65 | −1.14% | +9.81 |
| China Shanghai | 4,162.88 | 3,842.20 | −7.70% | +3.25 |
| Emerging markets (EEM ETF proxy) | 62.58 | 66.81 | +6.76% | +17.71 |
India in the red while most peers rose
How to read this chart: each bar shows a market’s price change between 27 February and 1 October 2026, calculated from Table 1. India is the outlier on the downside. The bars show how far apart the markets moved, not why, and they don’t adjust for risk.
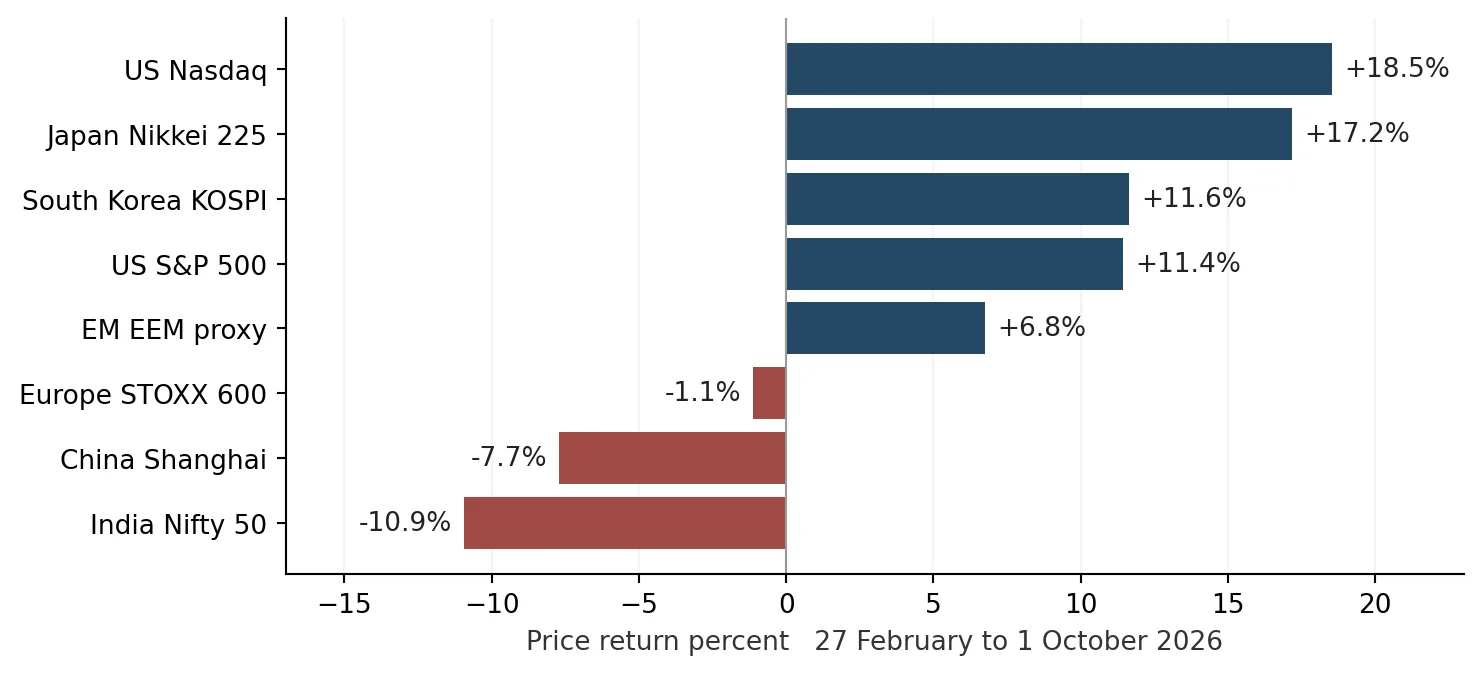
The gaps are big. India lagged the S&P 500 by more than 22 percentage points and the tech-heavy Nasdaq by almost 30. That is far too wide to explain away with a GDP headline. One caveat: these are local-currency price moves, without dividends or currency effects, so they tell us the markets diverged, not that investors will necessarily do better elsewhere from here.
The good news: much of the froth is already gone
The bearish version often skips an important fact: much of the excess has already come out. At the end of 2025, investors paid about 22.75 rupees for every rupee of Nifty earnings; today they pay about 19.19, nearly 16% less. That sits below the three- and five-year averages and below the 22x median since NSE moved to consolidated earnings. Every rupee of profit now costs less than it did a year ago. Any claim that India remains a bubble has to reckon with that.
Table 2 — Nifty now trades below its recent norms
| Window | P/E at start of window | Average | Median | Low | High | 1 Oct 2026 |
|---|---|---|---|---|---|---|
| 3 years | 21.5x | 21.8x | 22.0x | 19.2x | 24.3x | 19.2x |
| 5 years | 23.4x | 21.7x | 21.9x | 19.2x | 24.3x | 19.2x |
| 10 years | 21.6x | 24.6x | 23.2x | 19.2x | 39.6x | 19.2x |
Nifty valuations have cooled since the pandemic peak
How to read this chart: the line tracks the Nifty’s price-to-earnings ratio at the end of each year (2026 is as of 1 October). The break in the line marks the 2021 switch from standalone to consolidated earnings, so the two segments aren’t directly comparable.
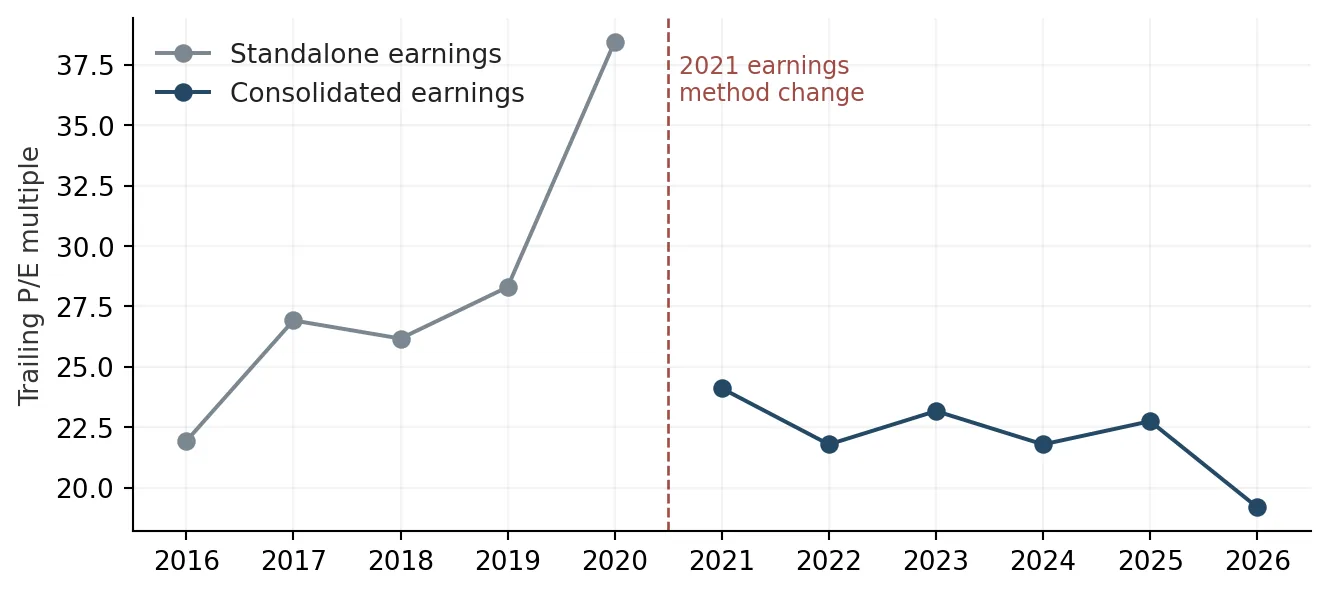
Two quirks in the chart are worth knowing about. The 2020 spike happened partly because pandemic profits collapsed, and depressed profits make any P/E look inflated. Then, on 31 March 2021, NSE switched from standalone to consolidated company accounts, which mechanically pushed the reported multiple down. So part of what looks like a decade-long cooling is simply a change in how the number is calculated. The cleaner comparison is within the post-2021 period, and that still shows a real decline.
There’s another way for valuations to come down, and it’s far more pleasant than a crash: earnings can simply catch up. If the Nifty stayed exactly where it is and company profits grew 12% a year, the P/E would fall to around 13.7 within three years. That’s an illustration, not a forecast, but it makes an important point. India can work off an expensive valuation through growth, not only through falling prices.
Stocks versus bonds: the gap has narrowed, not widened
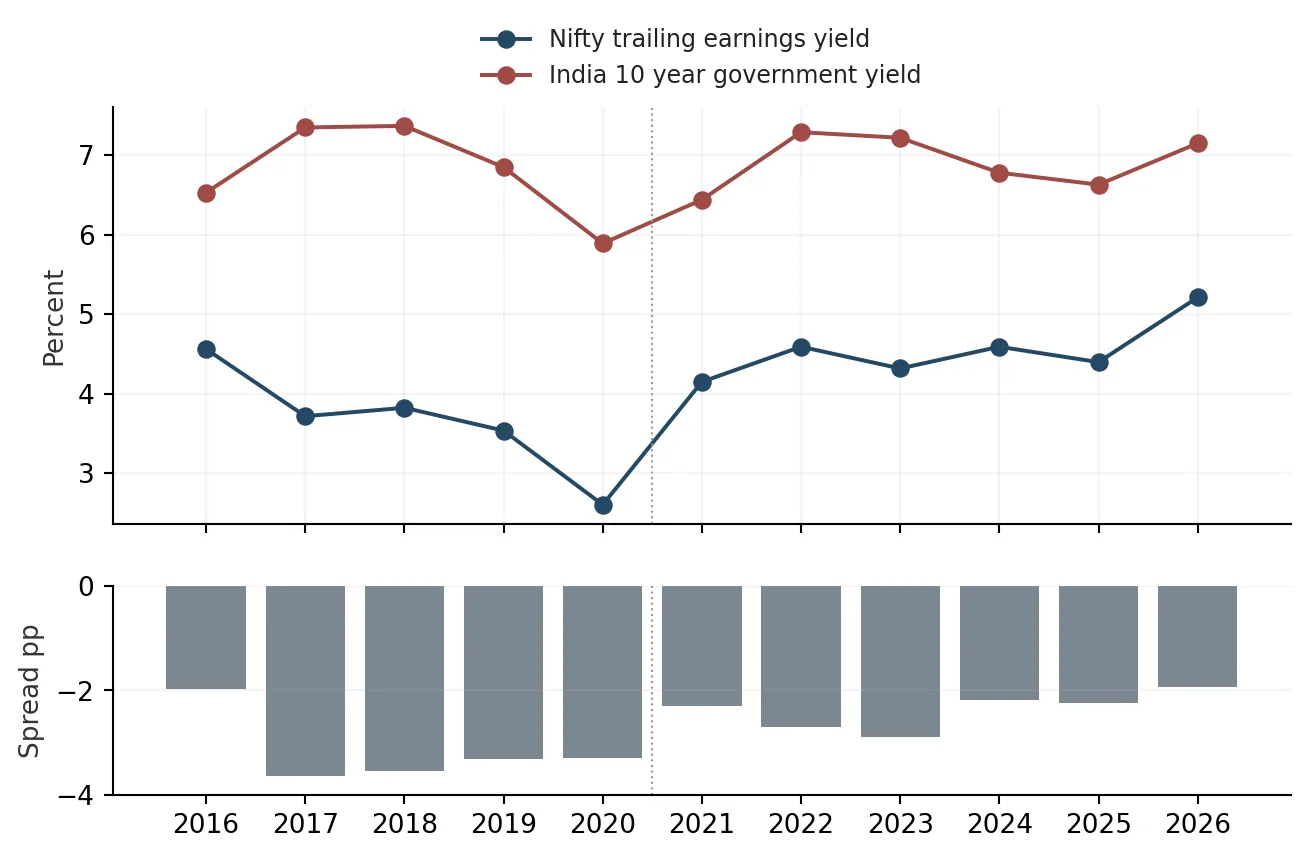
Rising Indian bond yields have made government paper more competitive, but not enough to erase the market’s repricing. Because share prices fell faster than profits, the Nifty’s earnings yield—profits as a percentage of price—rose by about 0.8 percentage points from 2025. The government bond yield rose by roughly 0.5 points. The gap therefore narrowed by around 0.3 points. Higher yields took back some of the improvement, not all of it.
Table 3 — Equities closed some of the gap with bonds
| Year | Nifty P/E | Earnings yield | India 10-year government bond yield | Earnings yield minus bond yield (pp) |
|---|---|---|---|---|
| 2016 | 21.93x | 4.56% | 6.53% | -1.97 |
| 2017 | 26.92x | 3.71% | 7.35% | -3.64 |
| 2018 | 26.17x | 3.82% | 7.37% | -3.55 |
| 2019 | 28.30x | 3.53% | 6.85% | -3.32 |
| 2020 | 38.45x | 2.60% | 5.89% | -3.29 |
| 2021 | 24.11x | 4.15% | 6.44% | -2.29 |
| 2022 | 21.79x | 4.59% | 7.29% | -2.70 |
| 2023 | 23.17x | 4.32% | 7.22% | -2.90 |
| 2024 | 21.79x | 4.59% | 6.78% | -2.19 |
| 2025 | 22.75x | 4.40% | 6.63% | -2.23 |
| 2026 | 19.19x | 5.21% | 7.15% | -1.94 |
A quick word on what this comparison does and doesn’t tell you. The earnings yield is not cash in your pocket; it is the profit companies earn relative to their share price, and much of it is reinvested rather than paid out. A bond yield, meanwhile, bakes in inflation and interest-rate risk. Neither number captures future earnings growth. You may hear that the Nifty would need to fall to about 14 times earnings to match the bond yield. That is just arithmetic (1 ÷ 7.15%), not a target or a fair value.
Cheaper stocks lifted the earnings yield faster than bond yields rose
How to read this chart: it compares the Nifty’s earnings yield with the Indian government bond yield at each year-end; the distance between them is the gap discussed above. Treat it as a rough historical picture, because the earnings basis changed in 2021 and the bond dates don’t line up perfectly.
India still costs more than most of its peers
Even after the correction, India is not cheap by global standards. Country ETFs offer only a rough comparison, but they place India below the US and Taiwan and above Japan, most of Europe, Korea and China. The markets are not like-for-like: each index has a different mix of banks, technology firms, energy companies and state-owned businesses, with different growth rates and risks. Sector composition alone explains part of the valuation gap.
Table 4 — How country valuations compare, today and historically
| Market | P/E | 5-year average | 10-year average | Earnings yield | India P/E premium/(discount) |
|---|---|---|---|---|---|
| United States | 24.07x | 23.12x | 20.58x | 4.15% | -12.3% |
| India | 21.11x | 23.05x | 21.03x | 4.74% | — |
| Japan | 19.15x | 15.04x | 14.64x | 5.22% | +10.2% |
| Germany | 17.28x | 14.59x | 14.05x | 5.79% | +22.2% |
| France | 16.49x | 16.66x | 15.73x | 6.06% | +28.0% |
| UK | 16.18x | 13.94x | 13.50x | 6.18% | +30.5% |
| South Korea | 10.53x | 10.84x | 10.40x | 9.50% | +100.5% |
| China | 8.66x | 9.82x | 11.08x | 11.55% | +143.8% |
| Taiwan | 28.18x | 16.79x | 15.51x | 3.55% | -25.1% |
India sits between pricey AI markets and cheaper Asian peers
How to read this chart: each bar is a market’s current price-to-earnings ratio, taken from Table 4. A taller bar means investors are paying more for each unit of profit. Because every market is built differently, the chart shows what investors are paying, not where returns will be best.
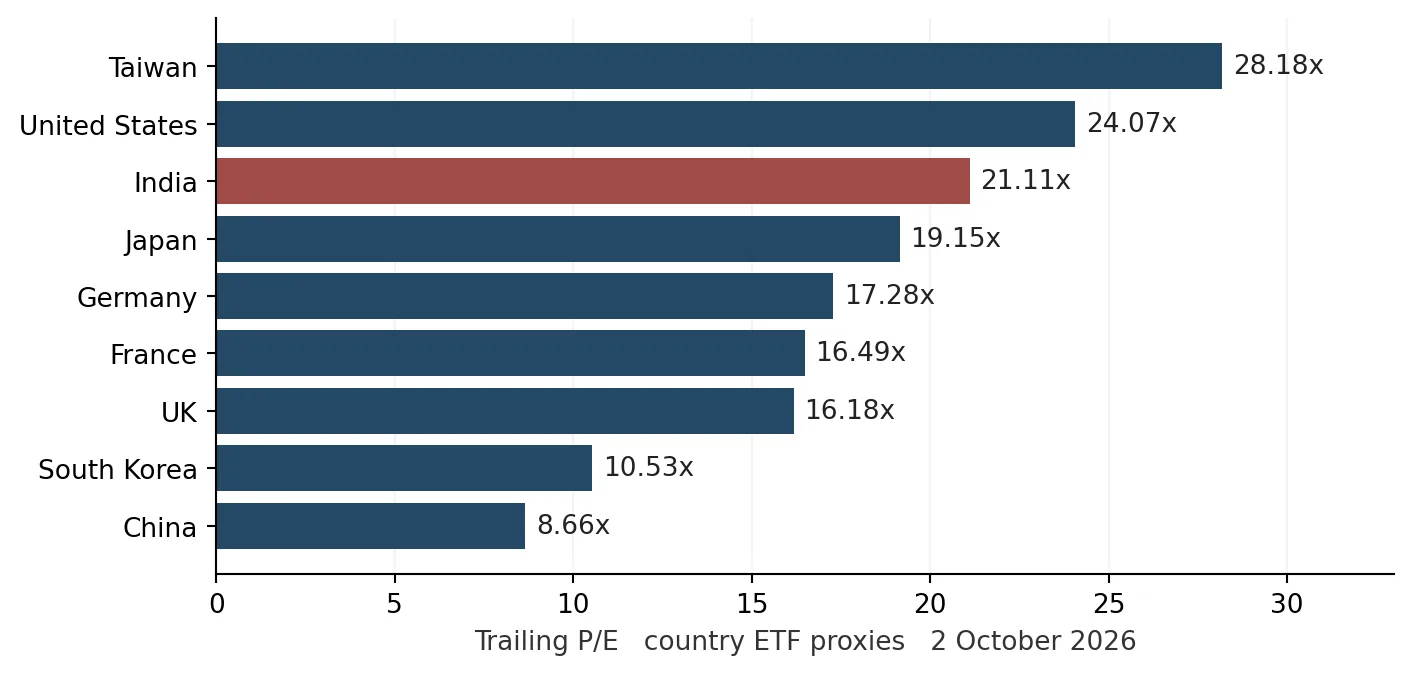
What matters is whether India’s earnings justify the premium. Korea offers a rival growth story through memory chips. China is cheaper, in part because investors demand compensation for policy and structural risk. Taiwan is the reminder that direct AI exposure is not automatically cheap: semiconductor markets can command rich prices too. The label does not guarantee a good entry point, or protection if the investment boom turns.
In the end, it all comes down to earnings
Stock returns have three moving parts: profit growth, dividends and the price investors are willing to pay for those profits. The third is the troublemaker. Earnings can rise while the index falls if the valuation multiple contracts. That is a large part of India’s story this year.
For those who like a formula: price return = (1 + earnings growth) × (ending P/E ÷ starting P/E) − 1. Add the dividends you received to get a rough total return. The popular shortcut of simply adding earnings growth, dividend yield and the change in the multiple gets you close, but not exactly there.
Table 5 — The earnings forecasts behind the original thesis
| Period | EPS growth estimate used in the original analysis | Interpretation |
|---|---|---|
| FY24 | About 20.7% | Strong earnings supported a growth premium |
| FY25 | About 2.0% | Weak delivery increased sensitivity to derating |
| FY26 estimate | About 8–12% | Historical forecast range; no longer a forward estimate |
| FY27 estimate | About 15–16% | Recovery assumption requiring delivery |
An example makes this concrete. Say you buy at 22 times earnings, profits grow a respectable 7%, but by year-end investors will only pay 19 times. Your price return is about −7.6%. A 1% dividend softens that to roughly −6.6%. Even with stellar 15% profit growth, the same drop in the multiple leaves you slightly down, at about −0.7%. Strong growth cushions the blow; it doesn’t make it disappear.
Decent earnings growth can be wiped out if valuations fall further
How to read this chart: each cell shows a possible one-year return, pairing a rate of earnings growth with an ending P/E. Every scenario starts from today’s 19.19x and assumes an unchanged 1.23% dividend [2]. These are scenarios, not forecasts, and they ignore tax, currency moves, reinvestment and costs.
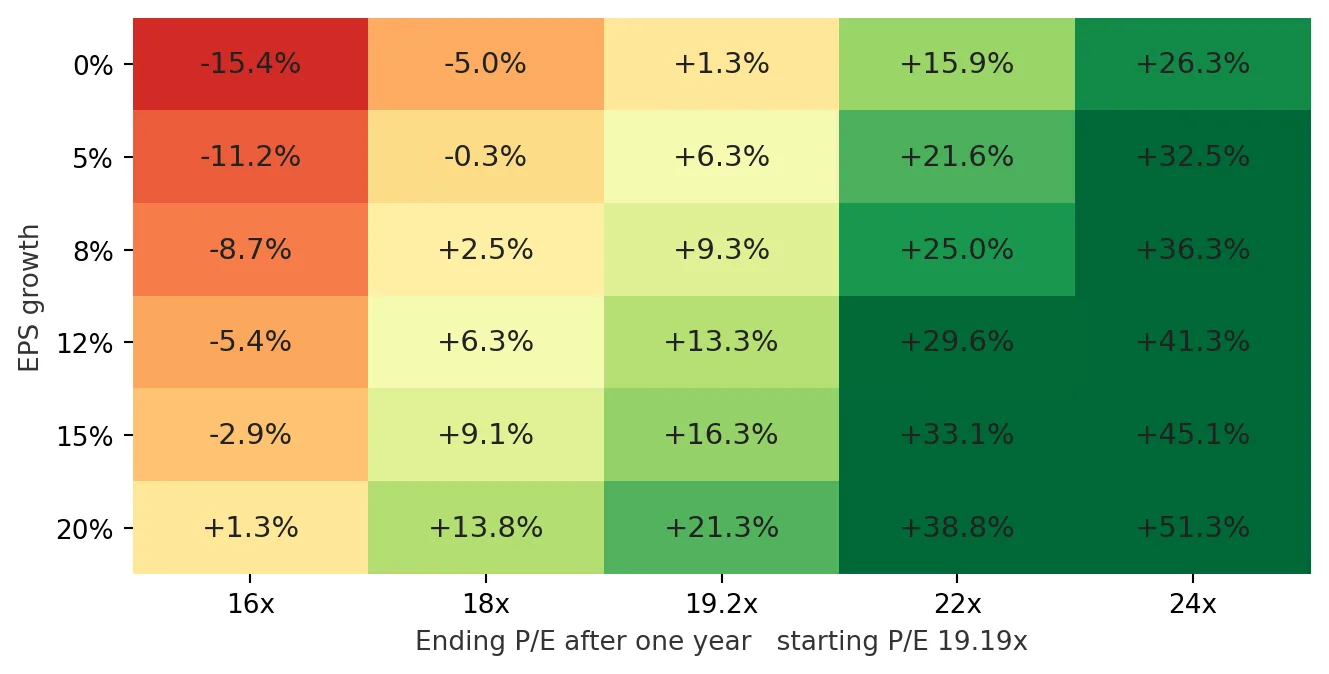
Two scenarios show how much hinges on valuation. If the multiple holds at 19.19 and earnings grow 8%, you make about 9.2% before tax and currency effects: not spectacular, but respectable. If the multiple slips to 16, the same 8% earnings growth leaves you down about 8.7%. So anyone making the case for India needs two views, not one: where earnings are going, and what investors will pay for them at the end.
Rising rates hurt, but they don’t explain who won
Rising interest rates are the easy explanation for India’s slide. Higher rates reduce the present value of future profits, but that relationship never operates in isolation. If yields rise because the economy is booming, profits may rise with them. If inflation or nervous bond markets are driving the move, there may be no such offset. Before blaming rates, ask why they rose.
Table 6 — Why rates alone don’t explain it
| Observation | Evidence / observation | Implication |
|---|---|---|
| US, third quarter 2026 | US 10-year yield rose more than 85 bps while the S&P 500 gained about 2% [6] | A rate shock can coexist with an equity gain |
| US valuation in 2026 | Forward P/E fell from 22x to 19.2x [7] | Earnings growth can offset multiple compression |
| Japan during 2026 | Earlier Yardeni-based estimate: forward EPS +23.6% and index +19.2% by mid-September | Price gains and derating can coexist; the figures are indicative because dates and coverage are not fully aligned |
| Selected global indices | US, Japan and Korea rose from 27 February to 1 October | A common global rate factor cannot by itself explain relative outcomes |
| Financial-sector economics | Higher rates can lift asset yields while funding costs and credit losses also change | The earnings effect depends on balance sheets and repricing |
For India, an oil shock is the worst kind of rate move. It pushes yields up while squeezing household budgets and company margins at the same time: a higher hurdle and lower profits together. For a company selling AI chips, by contrast, a big jump in sales can easily outweigh the same rise in global yields. That goes a long way toward explaining why markets moved so differently, although it still needs testing sector by sector.
It also matters what kind of rate rise we are talking about. If yields rise because inflation is expected to be higher, company revenues tend to rise too, which softens the blow. If real yields (after inflation) rise, the hurdle for stocks goes up more directly. I haven’t yet pulled together the data that would separate the two, such as inflation-protected Treasury yields and India’s inflation expectations, so the idea that real rates drove India’s underperformance remains a hunch, not a finding.
One more subtlety. There is no single “risk-free” rate for every investor. An Indian saver measures against Indian government bonds in rupees; an American investor measures against Treasuries in dollars. Currency risk and hedging costs sit between the two, and even government bonds can lose value if sold before maturity. Bond yields are a useful yardstick, but you can’t simply plug them into a formula for where to invest globally.
AI has given investors exciting places to put money outside India
“AI stocks” usually brings to mind a handful of US software names. The investment chain is much wider. Demand for computing power reaches chip designers, foundries, memory producers, networking firms and data-centre operators. The build-out also needs power equipment, electrical systems, cooling and construction. Then come the businesses that install and secure the technology. Shareholders still have to ask the ordinary questions: what price are they paying, how much capacity will be built, and who will keep the profits?
Table 7 — Where AI spending ends up
| Layer | Revenue or earnings channel | Representative businesses |
|---|---|---|
| Accelerators and networking | Compute purchases and system connectivity | Nvidia, Broadcom, AMD |
| Fabrication and equipment | Leading process nodes, packaging and capital equipment | TSMC, ASML and semiconductor-equipment suppliers |
| Memory | HBM and data-centre memory demand | SK Hynix, Samsung, Micron |
| Cloud and platforms | Compute rental, enterprise services and AI applications | Microsoft, Amazon, Alphabet |
| Power, cooling and facilities | Electrical capacity, thermal management and construction | Equipment, utilities, cooling and infrastructure suppliers |
| AI implementation and adoption | Integration, software engineering and productivity | IT services, software and companies deploying AI |
Note: this is a map of where AI spending flows, not a list of stock recommendations. The first four rows earn money more directly from AI; the conglomerates and enablers have plenty of other businesses too. Selling into the AI boom and rewarding shareholders are not the same thing.
The sums are enormous. Reuters reported that the largest cloud companies are expected to spend about $800 billion on capital investment in 2026, rising to roughly $1.1 trillion in 2027 [8]. Those figures are spending plans, not AI revenue, and they do not trace money leaving India. They do show the scale of the investment wave competing for global capital. Whether that spending earns an adequate return remains open.
There is a catch. AI spending helps the companies selling chips and servers, but drains cash from the companies buying them. If capacity arrives faster than demand, an industry can expand while its shareholders lose money; the telecom and fibre-optic boom of the late 1990s is the familiar warning. Investors still have to work company by company: Are customers committed? How concentrated are they? What return will the next round of investment earn? What is already in the share price? Spending proves activity, not superior long-term returns.
Some argue that the AI spending boom is itself pushing interest rates higher by soaking up capital. That’s plausible, but I haven’t tested it. Government borrowing, inflation, central-bank policy and corporate demand for capital all feed into rates, so I’m not blaming AI for the rise in Treasury yields or for foreign money leaving India.
India uses AI, but owns little of the AI profit
Buying the Nifty means buying a market dominated by finance: banks and other financial firms make up 37.45% of the index, while IT accounts for just 7.52%. Telecom, power and capital goods provide some connection to the AI build-out, but a sector weight is not an earnings exposure. A bank using AI to lower costs and a chipmaker selling the hardware have very different economics—and very different upside.
The Nifty is dominated by banks and financial firms
How to read this chart: each segment shows a sector’s share of the Nifty 50 as of 30 September 2026. The labels describe what the companies do, not how much they earn from AI.
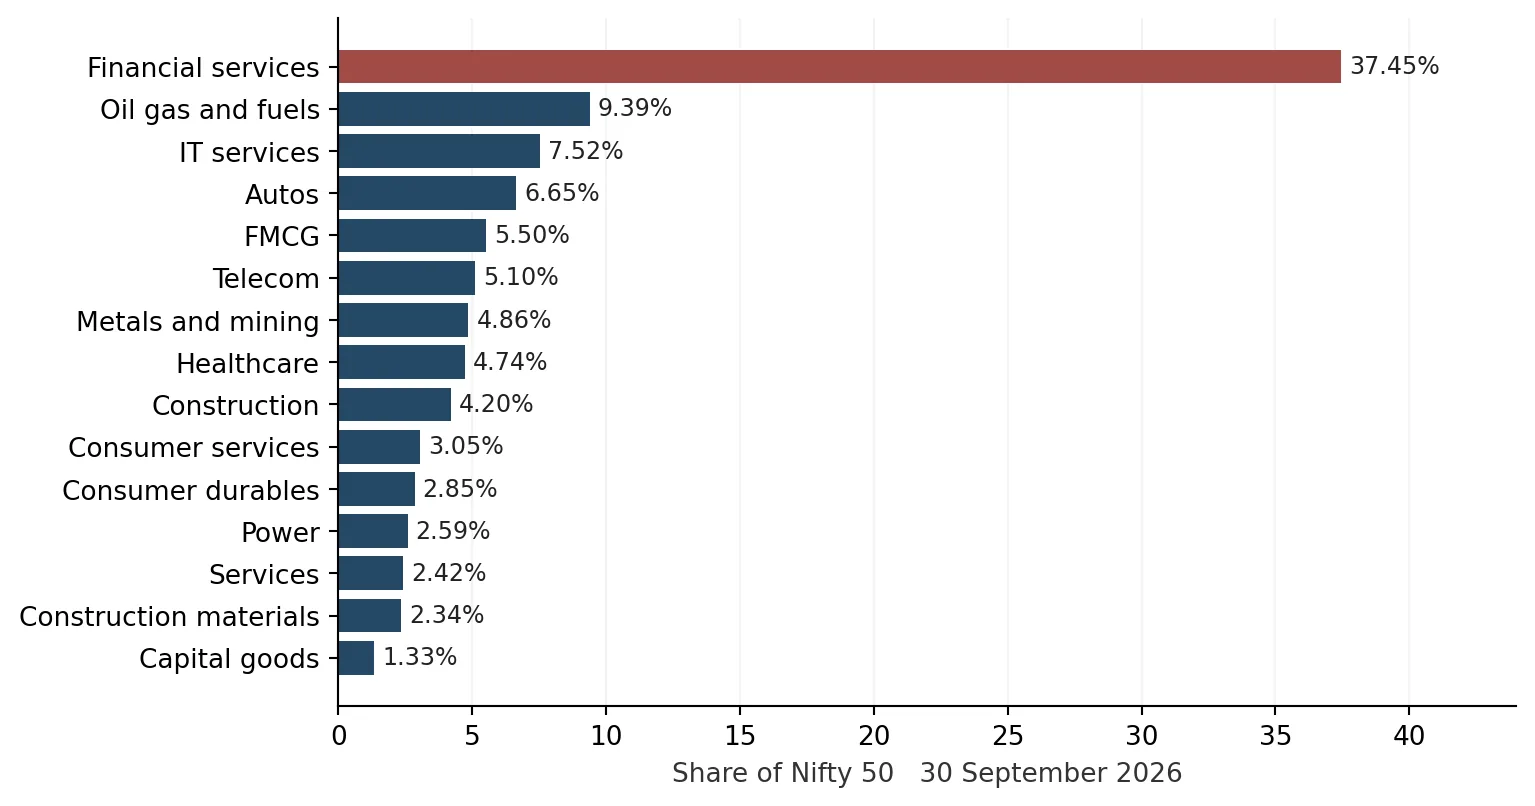
Table 8 — Being touched by AI is not the same as owning its profits
| Exposure type | Illustrative Indian examples | How exposure reaches earnings |
|---|---|---|
| Core compute, chips, cloud and models | No clear large-cap Nifty pure play identified | Limited direct ownership of frontier compute or model economics |
| Infrastructure and materials | Bharti Airtel; L&T; NTPC; Power Grid; Hindalco; Tata Steel; Adani Enterprises | Data centres, connectivity, power, construction and materials; exposure is diluted by broader businesses |
| Implementation and services | TCS; Infosys; HCL Technologies; Tech Mahindra | Consulting, engineering, integration and managed services |
| Diversified emerging exposure | Reliance Industries | Jio cloud and AI initiatives within a broader group |
| Adoption and productivity | Banks, finance, consumer, pharma, autos and platforms | Revenue growth, cost savings, risk management and service improvements |
Note: these categories can overlap; HCL, for example, has both implementation and infrastructure businesses. They are rough groupings, not a precise breakdown of revenue, and index membership changes over time.
Interestingly, NSE itself has launched a Nifty AI Catalysts index aimed at the companies that build the plumbing: computing, connectivity, power, cooling, engineering, cables and materials [10]. That is a better place to look for India’s AI infrastructure plays than lumping every IT services firm in with the chipmakers. Still, being in the index means a company fits the theme; it doesn’t tell you how much AI revenue it earns, or that the stock will beat the market.
Not all Indian “AI stocks” are the same
Indian companies with an AI angle have had wildly different years. That is hardly surprising: an infrastructure supplier and an IT services firm may share a theme without sharing a business model. Nor can the performance gap be pinned on AI alone. Rates, industry cycles, margins, execution and one-off events all move share prices. The table is a research list, not a verdict.
Table 9 — A dozen Indian AI-linked stocks and their one-year performance
| Company | Approx. price (INR) | 1-year price return | AI earnings channel |
|---|---|---|---|
| HCL Technologies | 1,248 | −10% | Infrastructure software and services |
| Bharti Airtel | 1,746 | −6.5% | Connectivity and data infrastructure |
| Larsen & Toubro | 3,693 | +0.9% | Engineering and data centre capex |
| NTPC | 317 | About −7% | Incremental electricity demand |
| Power Grid | 255 | −9.3% | Grid investment and electrification |
| Hindalco | 939 | +22.6% | Copper aluminium and materials |
| Tata Steel | About 178 | About +3–6% | Construction and industrial materials |
| Adani Enterprises | 2,825 | +12.4% | Diversified data centre infrastructure |
| Infosys | 1,029 | −28.8% | Implementation and consulting |
| TCS | About 2,075 | About −28% | Implementation and managed services |
| Tech Mahindra | 1,533 | +8.3% | Telecom and enterprise transformation |
| Reliance Industries | About 1,168 | About −14% | Jio cloud and emerging AI initiatives |
For Indian IT services, one question matters above all: who keeps the savings when AI makes the work faster? Suppose a project that once needed 100 engineers now needs 60. Under an hourly contract, the provider may lose revenue. Under a fixed-price contract, it may keep the savings and lift its margin. Faster delivery could attract more work, while clients press for lower prices. The outcome will turn on pricing, staffing and the volume of new business.
Table 10 — How AI productivity plays out under different contracts
| Model | Illustrative immediate effect | What must be tested |
|---|---|---|
| Time and materials | Fewer billable hours can reduce revenue | Rate increases, redeployment, demand and utilisation |
| Fixed price | Lower delivery cost can increase margin | Scope, competition, pricing resets and execution costs |
| Outcome based | Value delivered can sustain fees with lower cost | Measurable outcomes, contract terms and customer bargaining |
| New AI services | Integration, data, security and governance can create work | Bookings, revenue conversion and incremental margin |
So India as a whole could win from cheaper AI, with businesses across the economy getting more productive, even as its traditional IT outsourcers come under pricing pressure. That would shift where the profits sit within the Indian market rather than simply shrink them. Before calling any IT company an AI winner, I’d want to see its AI deals, the revenue actually booked, its pricing and its delivery margins.
The AI boom is real, but so are the risks
The AI story outside India is not just hype; a visible cycle of demand and capital spending sits behind it. But industry growth and shareholder returns can part company. Some businesses will post genuine commercial wins even if the sector overbuilds, and the cloud giants may earn healthy returns on existing assets while the next dollar of spending earns far less.
Cheaper AI may also produce more AI use, much as more efficient steam engines once led Britain to burn more coal rather than less. Lower prices can make new applications worthwhile, although total spending will still depend on demand, efficiency, idle capacity and pricing. That creates an opening for India: if the technology keeps getting cheaper, Indian companies can capture many of the same productivity gains without owning the frontier models or chips.
This does not mean every rupee withdrawn from India went into an AI stock. Outflows do not reveal the next destination of the money; that would require fund-level data. The narrower point is enough: AI has created a compelling alternative mix of growth, valuation and risk, and India now has to compete with it.
Oil and a weak rupee: a double hit
Because India imports most of its oil, a price shock lands in several places at once: the import bill rises, inflation picks up, household budgets tighten and business costs climb. Tax and pricing policy determine who feels the pain first. A weaker rupee makes the bill worse, while services exports, remittances, foreign-exchange reserves and companies’ ability to pass on costs provide some cushion. The size of the shock ultimately depends on how much Indian consumption and production still runs on imported fuel.
Table 11 — India’s stress points at a glance
| Variable | 27 Feb 2026 | Early Oct 2026 | Change / context |
|---|---|---|---|
| Nifty 50 | 25,178.65 | 22,421.95 | −10.95% |
| Sensex | 81,287.19 | 71,909.70 | −11.54% |
| Brent crude | About $73/bbl | About $102/bbl | About +40% |
| USD/INR | 91.01 | About 96 | Rupee value down about 5.2% against the US dollar |
| US 10-year Treasury | 3.96% | 5.233% close on 1 Oct | About +127 bps using the two observations shown |
| India 10-year government bond | 6.66% | 7.21% | +55 bps; Table 3 uses a separate 7.15% September observation |
| Foreign equity flows | — | About −$27.8bn year-to-date in 2026 | Calendar-year net foreign selling reported on 1 Oct [11] |
An oil shock can squeeze consumers and companies at the same time. Households cut discretionary spending, while manufacturers and transport firms pay more for inputs. Producers may benefit, so the effect on the index depends on what the index owns. With banks carrying so much weight in the Nifty, credit demand, funding costs and bad loans matter too. Oil does not map neatly onto the market.
India can reduce this vulnerability over time. Renewables, nuclear power and electrification all limit dependence on imported fossil fuels; electricity used by air conditioners, data centres or factories is not the same as burning imported oil. The pace of electric-vehicle adoption, freight efficiency and changes in the power mix will determine how closely the import bill follows economic growth. Energy exposure matters, but it has to be measured rather than assumed.
Currency adds another layer. For a foreign investor, a weaker rupee directly erodes the return. The calculation is: dollar return = (1 + rupee return) × (starting USD/INR ÷ ending USD/INR) − 1, where USD/INR is rupees per dollar. Simply subtracting the currency decline from the stock return is only an approximation.
A weaker rupee can wipe out much of a local stock gain
How to read this chart: it shows how different amounts of rupee depreciation (the fall in the dollar value of one rupee) shrink a local stock gain once it is converted into dollars. These are illustrations, not actual returns, and they ignore dividends, tax, hedging and costs.
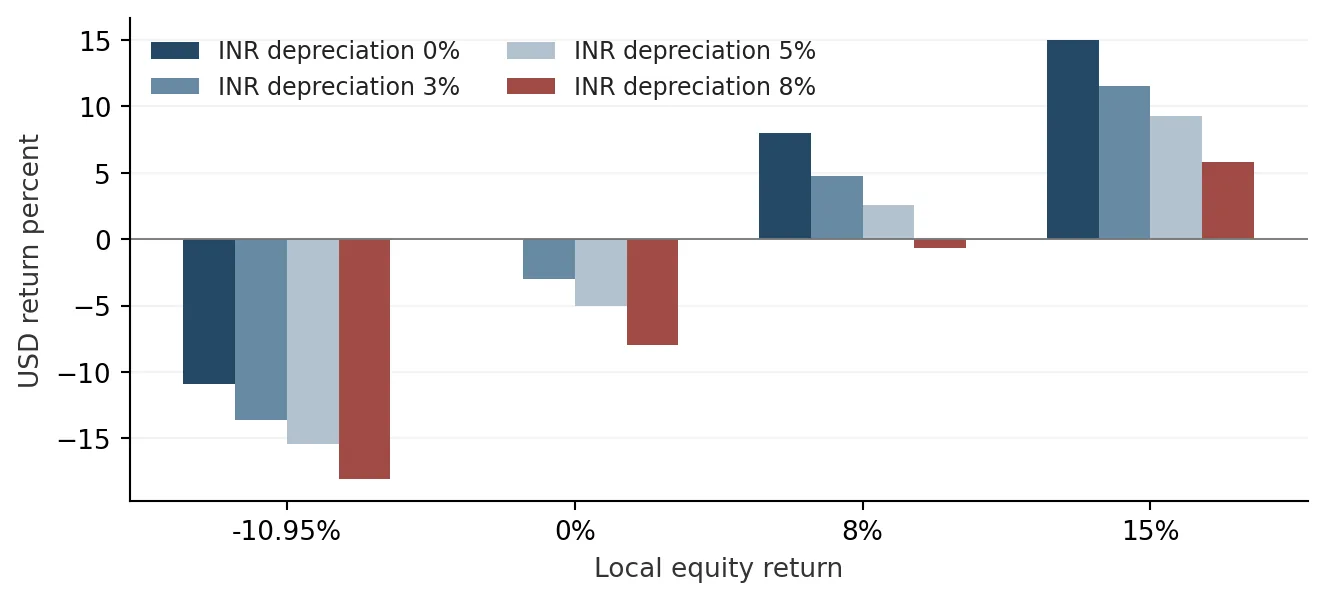
Table 12 — The currency can change the outcome
| Case | Local equity return | Currency move | USD return |
|---|---|---|---|
| Illustrative positive market | +8.00% | Rupee value −5.00% | +2.60% |
| Nifty move using approximate FX endpoints | −10.95% | USD/INR 91.01 to about 96 | About −15.58% |
| Illustrative return needed for a 12% USD gain | +17.89% | Rupee value −5.00% | +12.00% |
Note: these are calculated scenarios. The middle row combines the Nifty price move with approximate exchange-rate endpoints and is not a verified total return. The final row shows the local-currency return required to earn 12% in US dollars if the rupee loses 5% of its value. The 12% figure is an illustration, not a recommended hurdle.
Local investors are holding the market up, while new share sales compete for their money
The market has not collapsed despite foreign selling because Indian investors have kept buying. Mutual funds, insurers, pension products and individuals have absorbed much of the supply. That does not prove prices are too high, or that domestic investors are indifferent to returns. They invest in a different currency, often with a longer horizon and different constraints from a fund manager in New York or London.
My working theory is that domestic savings are supporting valuations while foreign investors remain unconvinced. Proving it requires matched data on institutional buying, mutual-fund subscriptions and redemptions, new issuance and price effects. Monthly SIP contributions are not the same as net stock purchases; some of the money covers redemptions or flows into other assets.
New stock is also competing for the same pool of savings. IPOs and follow-on sales can fund genuine investment; promoters and early investors selling down merely transfer ownership. Either way, buyers must provide cash that might otherwise have gone into existing shares. Comparable data are insufficient to support a claim of record issuance. The narrower point about supply still holds.
Table 13 — What would establish the domestic-savings thesis
| Flow | Relevant measure | Reason |
|---|---|---|
| Foreign portfolio activity | Net foreign equity flows over a consistent period | Measures foreign demand without assuming it caused price moves |
| Domestic institutions | Net domestic institutional purchases over the same period | Shows how much foreign selling was absorbed |
| Mutual fund investors | Net equity subscriptions and redemptions | Gross SIP inflows overstate the cash available for net buying |
| New and secondary issuance | IPOs, QIPs, divestments and secondary sales measured separately | Separates new corporate capital from ownership transfers |
| Alternative savings assets | After-tax yields on bonds, deposits and credit products | Measures the domestic opportunity cost of equities |
| Market valuation | Price, EPS and P/E measured on matched dates | Tests whether domestic liquidity supported valuation multiples |
Taxes, regulatory uncertainty, capital controls and trading costs also reduce what investors take home. They matter more when India’s growth premium narrows. But no specific tax or rule change has been tied here to this year’s slump. That argument would need a named measure, an effective date, an affected group and evidence of the response.
These frictions can tip a close decision, but the evidence is weaker than it is for falling prices, cheaper valuations and foreign selling. Claims about India’s business environment should rest on specific policies and their effect on profits or market access, not a general feeling that conditions have worsened.
Where my argument holds, and where it could be wrong
The argument has clear weak points. The Nifty is already cheaper. Earnings growth can lower the valuation without another fall in prices. Rising yields did not stop other markets from rallying. The AI boom may disappoint; India can reduce its dependence on imported energy; domestic investors may simply be taking a sensible long view. None of this overturns the case, but it defines the evidence that would change it.
Table 14 — What would change my mind
| Proposition | Evidence that would weaken it | Current assessment |
|---|---|---|
| Earnings cannot justify the premium | Sustained realised EPS acceleration, stable margins and broad-based upgrades | Conditional; depends on updated earnings forecasts |
| Rates explain relative weakness | Peers keep rising despite comparable increases in real yields | Rates amplify the pressure but do not explain the relative outcome alone |
| AI alternatives are more compelling | AI revenue misses expectations, capex slows, returns on capital weaken or valuations outrun profits | AI is a competing opportunity set; a future return advantage is not established |
| Oil materially depresses earnings | Oil falls, cost increases are absorbed, and margins or consumption remain resilient | Exposure is plausible; the aggregate earnings effect remains unmeasured |
| Currency erodes foreign returns | The rupee stabilises or appreciates, or hedged returns improve | The translation effect is mechanical; the currency outlook remains uncertain |
| Domestic flows prevent further derating | Net domestic buying weakens or earnings catch up with prices | Requires matched foreign, domestic and issuance data |
| India lacks listed AI beneficiaries | Material AI revenue and cash flow emerge in benchmark companies | Current benchmark composition can change |
| Policy friction drives selling | No clear market response follows a specific policy change, or foreign selling persists under different rules | No principal policy cause has been established |
A falling market is the event to be explained, not proof that every proposed cause was active. The starting date matters as well: this comparison begins amid geopolitical and interest-rate stress, not at the start of a full cycle. Other windows, common-currency returns and sector-adjusted comparisons would help separate a temporary shock from a lasting shift in capital.
Strong markets elsewhere carry their own risks. A rising index can hide many falling stocks, and investors who overpay for exceptional earnings may still be disappointed. India’s weakness could make it a better buy from here. Past outperformance and exciting growth stories are no substitute for estimating what each market can return from today’s price.
So what should investors actually do?
The practical response is to do the arithmetic rather than rely on instinct. Start with a realistic earnings forecast using consistent periods and company sets. Choose an ending valuation that reflects the market’s sector mix and profitability. Add expected dividends, convert the result into your own currency and include hedging costs where relevant. Then compare it with what government and corporate bonds can pay over the same period.
Table 15 — The signals to watch from here
| Monitor | Measure | Decision implication |
|---|---|---|
| Earnings delivery | Realised index EPS, revisions, margins and sector breadth | Raises or lowers confidence in earnings growth at roughly 19x P/E |
| Valuation | Trailing and forward P/E on a consistent earnings basis | Separates genuine repricing from changes in the earnings base or methodology |
| Rates | India 10-year yield; US real yields, inflation breakevens and term premium | Separates inflation, growth and discount-rate effects |
| Oil and external accounts | Oil imports, current account, services exports and remittances | Tests the persistence of currency and margin pressure |
| AI earnings | Bookings, recognised revenue, cash flow and marginal returns | Identifies beneficiaries whose economics justify their valuation |
| Flows and supply | Net foreign portfolio investor (FPI) and domestic institutional investor (DII) flows; subscriptions, redemptions and issuance | Tests whether domestic buying is absorbing foreign selling and new share supply |
| Investor return | Common-currency total returns, fees, taxes and hedging costs | Produces a comparable allocation outcome |
For a broad India allocation, ask how much earnings growth and dividend income today’s price buys after currency and valuation risk. For an individual company, ask what will drive earnings, who captures the benefit and how much bad news is already priced in. The same discipline applies to an Indian bank or IT firm as to a foreign AI chipmaker.
Indian stocks now face a tougher test, even after the sharp fall in valuations. The market can become more attractive through stronger earnings, a lower price, cheaper oil, a steadier rupee or new investment themes that turn into listed profits. India’s economic potential still matters. But investors do not own the potential in the abstract; they own earnings at a price.
References
- 1Reuters 1 October 2026 US closing market report. Confirms S&P 500 7,666.48 and Nasdaq 26,871.60 ending closes.
- 2Downstox Nifty 50 P E chart and historical series. NSE-derived P/Es, monthly ranges, dividend yield and the 2021 earnings-method change.
- 3FRED OECD India long term government bond series. Used for the historical 2016–2025 bond-yield observations; 2026 is shown separately from a market snapshot.
- 4World PE Ratio country ETF valuation panel. Retrieved 2 October 2026. Uses ETF proxies and trimmed historical averages, not the same local indices as the performance comparison.
- 5ICICI Direct ETF market strategy market-strategy analysis. Source for the historical FY24–FY27 EPS growth estimates used in the original thesis.
- 6Reuters third quarter equity and bond commentary 1 October 2026. Rate and equity counterexample. Reported aggregate profit-growth statistic not used as a matched Nifty EPS comparator.
- 7Reuters US earnings and valuation report 1 October 2026. US forward valuation contraction; no direct comparison with trailing Nifty P/E.
- 8Reuters global fund flows report 2 October 2026. Reported hyperscaler capex expectations; forecasts rather than realised investment returns.
- 9NSE Indices Nifty 50 factsheet 30 September 2026. Official sector weights; figures are the dated September snapshot although the link is updated periodically.
- 10NSE Indices Nifty AI Catalysts definition. Official enabling-infrastructure scope. Index membership is not a quantified AI earnings share.
- 11Reuters Indian benchmark and foreign flow report 1 October 2026. Confirms reported cumulative foreign equity outflow of approximately $27.8bn in 2026.
- 12MarketWatch US close and Treasury yield report 1 October 2026. Reports 10Y close at 5.233%; replaces inconsistent latest US yield approximations.
- 13Author’s research notes, 1–2 October 2026. Used for the 12-company AI-linked equity snapshot and supporting valuation/rates context. Stock observations are approximate and do not constitute a complete Nifty 50 panel.