A seed fund can spot a winner early, then find it cannot afford to keep its stake. Megalith, which has reportedly raised about $300m, is building a business around that gap. When a seed fund cannot use its pro rata allocation—the option to buy shares in a later round—outside capital may buy the new shares with the company’s consent. The seed manager may receive a share of the profit, or carry, while the specialist earns fees. But the fund’s own investors still dilute. Who, then, is this arrangement really helping?
Start with the pro rata right: the paperwork matters more than the label. It is contractual, not automatic. It usually sits in an investor rights agreement or a side letter, or, for SAFE investors, in a separate pro rata side letter. It gives an existing investor the option, but not the obligation, to buy its share of the new shares in a later round and so hold on to its percentage ownership. Companies often restrict it to “Major Investors” above a certain stake or cheque size. The details also vary from deal to deal: which rounds the right covers, how ownership is measured and whether the right can be transferred at all.
The arithmetic looks simple: a fund with 5% of a company would put $1m into a $20m new-money round to buy 5% of the new shares. But that protects its stake only against shares sold in that round. An expanded option pool or converting SAFEs and notes can dilute it at the same time. The follow-on cheque also comes at a higher price and concentrates more of the fund in one company.
An outside cheque solves the funding problem, not the ownership problem. With the company’s consent, the specialist buys the new shares; the seed fund does not. Its manager may earn carry from the follow-on vehicle and maintain the founder relationship without using fund reserves, but the fund’s LPs still own only their original, diluting stake.
For the seed fund, this is a question of reserves. A seed manager can identify an exceptional company early and still be unable to defend its ownership, because every later round requires a larger cheque at a higher price.
The fundraising numbers help explain the squeeze. The NVCA’s 2026 Yearbook reported a sharp decline in the number of US venture funds raised in 2025, while 2026 data show capital becoming more concentrated in large vehicles. Through Q3 2026, funds of $500m or more accounted for 78% of capital raised despite representing only 6% of new funds; only 211 emerging firms had closed a fund, compared with 927 in 2022. [1–3]
| Indicator | Reported figure | Reference |
|---|---|---|
| US venture fundraising, 2025 | $67bn across 585 funds (Yearbook); revised to $78.3bn across 1,094 funds (Q3 2026) | [1, 3] |
| US venture fundraising, H1 2026 | $72.4bn across 405 funds | [2] |
| US venture fundraising, through Q3 2026 | $108.5bn across 699 funds | [3] |
| Capital raised by funds ≥$500m | 78% of capital from 6% of new funds | [3] |
| Emerging firms closing a fund | 211 through Q3 2026 vs 927 in 2022 | [3] |
| First-time funds through Q3 2026 | $4.9bn across 81 vehicles | [3] |
Seed funds may keep discovering promising companies while larger pools of capital fund their later rounds. A specialist can pay for an unused allocation. The original fund’s percentage ownership still falls. That distinction matters when judging whose problem the deal solves.
2. The right creates access, but the documents decide whether it is usable
A signed right is not a guaranteed allocation. The company may restrict it to “Major Investors,” cap the purchase, define ownership differently or exclude certain issuances. In a hot round, the new lead may also press to reduce existing investors’ allocations. A specialist must check the documents and the company’s willingness to honor the proposed purchase, not just the headline pro rata percentage. [4]
For a specialist like Megalith, the first question is simple: can anyone other than the original holder use the right? YC’s post-money SAFE no longer includes a pro rata right by default; where one is granted, it sits in the optional side letter. That side letter bars assignment without the company’s consent, except to entities under common control with the investor, which can include other funds run by the same general partners or management company. In practice, then, an outside specialist usually needs the company to agree, unless the deal is routed through an eligible affiliate. [5, 6]
The stakes are higher in rescue and down-round financings, where pay-to-play terms are becoming more common. Depending on how the clause is drafted, an investor that does not take part can lose its liquidation preference, anti-dilution protection, voting rights, board seat or future pro rata rights. Having an outside party subscribe in the fund’s place does not necessarily help, because the clause may be written around the holder and its affiliates. In that case, a shortage of reserves can cost the fund rights it already has. [7]
| Structure | How it works | Main diligence issue |
|---|---|---|
| Affiliated SPV | Vehicle associated with the rights holder subscribes using outside capital | Does it qualify as an affiliate under the signed documents? |
| Co-managed SPV | Originator and specialist share management and economics | Who controls the vehicle and waterfall? |
| Direct subscription | Company admits the specialist as the buyer | Company/lead consent and future investor rights |
| Capital into deal SPV | Specialist finances an originator-associated vehicle | Layered fees, carry and control |
What it costs to keep a stake
The first chart shows how quickly reserve needs grow. Suppose a $30m seed fund wants to hold a 5% stake. To do that, it has to invest 5% of every round: $1.0m in the Series A, $3.0m in the Series B and $7.5m in the Series C. That is $11.5m in total, or 38% of the fund, committed to a single company. The table extends the comparison across fund sizes and target stakes, where the share of the fund required ranges from 17%, for a $40m fund holding 3%, to 81%, for a $20m fund holding 7%.
That is the cost of holding the stake, not a case for writing every follow-on cheque. Outside finance is useful only when the fund cannot or will not fund the round itself, the company permits the arrangement, and the new shares offer an attractive return at their current price.
What it costs to keep a stake

Sensitivity: total follow-on requirement as % of fund

Who owns what after dilution
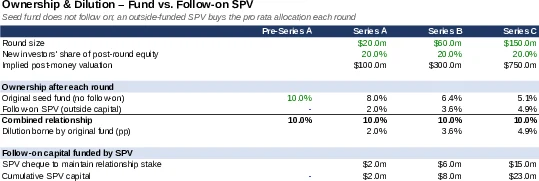
Unlike the preceding 5% reserve example, the second chart starts with a 10% seed-fund stake and follows it through three rounds, each of which sells 20% of the company to new investors. If the seed fund does not invest, its stake falls from 10% to 8%, then to 6.4% and finally to 5.1%. Over the same period the SPV invests $2m, $6m and $15m, $23m in total, and builds a 4.9% stake, so the fund and the SPV together still hold 10%.
The combined position is still 10%, but the owners have changed. The original fund now holds 5.1%; the outside-funded SPV holds 4.9%. Unless the seed fund’s LPs also invest in that SPV, they do not own its new shares. Defending the fund’s full 10% instead would require $23m across the rounds—about 77% of a $30m fund. Whether the SPV’s later, larger cheques pay off depends on the returns available at those later entry prices.
How the cash is split
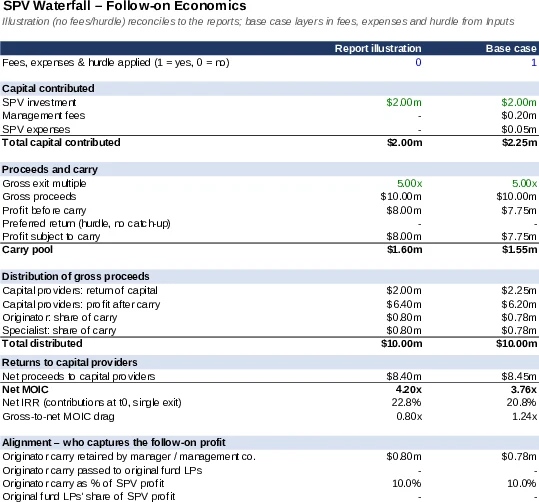
The third chart follows the money through one deal. A $2m investment returns $10m at a 5x exit, and the proceeds are paid out in a fixed order: capital is returned first, then any hurdle is met, and only then is the profit split, with 20% of it going to carry. In the fee-inclusive case, providers contribute $2.25m ($2m invested, $0.20m in management fees and $0.05m in expenses); $10m of proceeds less $1.55m of carry leaves them $8.45m, or 3.76x. The chart sets this alongside the no-fee 4.20x result.
In the 5x example, capital providers receive 4.20x without fees and 3.76x after the modeled fees and expenses. Carry depends on profit; the specialist’s $0.20m fee does not. The originator and specialist each receive $0.78m in carry in the fee-inclusive case. At a modest exit, those fixed charges take a bigger bite out of the proceeds.
Ownership & Dilution – Fund vs. Follow-on SPV
Each party's position side by side
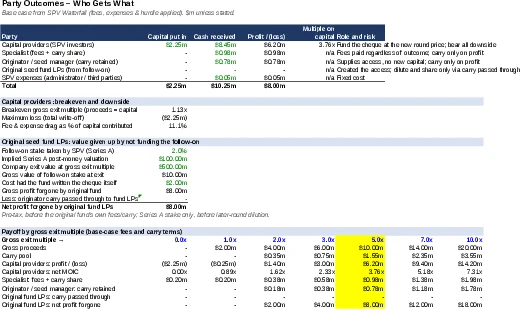
The fourth chart looks at each party in turn: what it invests, what it receives, and what it earns. It also shows the breakeven point, what the original fund's investors give up, and each party's payoff at exits from 0x to 10x.
Within the SPV, outside capital providers bear the investment loss while the specialist receives its fixed fee. At a 1x exit they recover only 0.89x of their $2.25m contribution; they need an exit above roughly 1.13x to break even. At a write-off, they lose that contribution and the originator receives no carry. The seed fund’s LPs face a different risk: their original stake can also lose value, and they receive no return from new shares bought by the SPV unless they invested in it.
Party Outcomes – Who Gets What
SPV Waterfall – Follow-on Economics
What changes the outcome
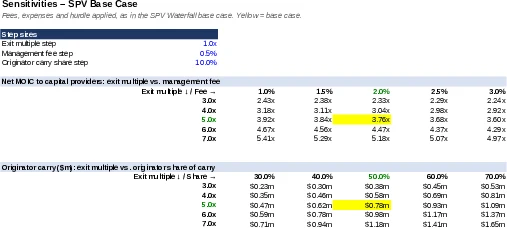
Two sensitivity tables in the fifth chart show which inputs move the result. The first shows the net multiple across exits of 3x to 7x and management fees of 1% to 3%: at a 3x exit, the net multiple falls from 2.43x to 2.24x as fees rise, and at a 7x exit it falls from 5.41x to 4.97x. The second shows the originator's carry across different exits and carry splits, ranging from $0.23m at a 3x exit with a 30% share to about $1.6m at a 7x exit with a 70% share.
The exit matters far more than the fee. Moving from a 3x to a 7x exit adds about 3x to the net multiple, while moving the fee from 1% to 3% costs only about 0.2–0.4x. Fees remain a drag even in a big win, and consume a larger share of returns in a modest outcome. For the originator, the carry split is the main term it negotiates; for everyone else, choosing the right companies matters more than negotiating the terms.
Sensitivities – SPV Base Case
The alternative: buying on the secondary market
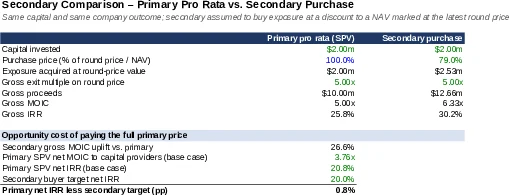
The secondary comparison asks what the same $2m could buy at 79% of NAV instead of the full round price. On the model’s identical exit assumptions, that discount raises the gross multiple from 5.0x to 6.33x—a 26.6% lift—and gross IRR from 25.8% to 30.2%, a gain of 4.3 percentage points.
The discount shows what an investor might give up by paying the full round price for access. But this is not an apples-to-apples investment test: the primary SPV’s 20.8% IRR is net of modeled fees and expenses, while the secondary scenario’s 30.2% is gross and assumes identical exit value. The cited 20% secondary-buyer target is a benchmark, not proof that either transaction is available on these terms. The case for the primary cheque depends on access, rights, fees and the actual price of comparable secondary shares.
Secondary Comparison – Primary Pro Rata vs. Secondary Purchase
What the portfolio simulation shows
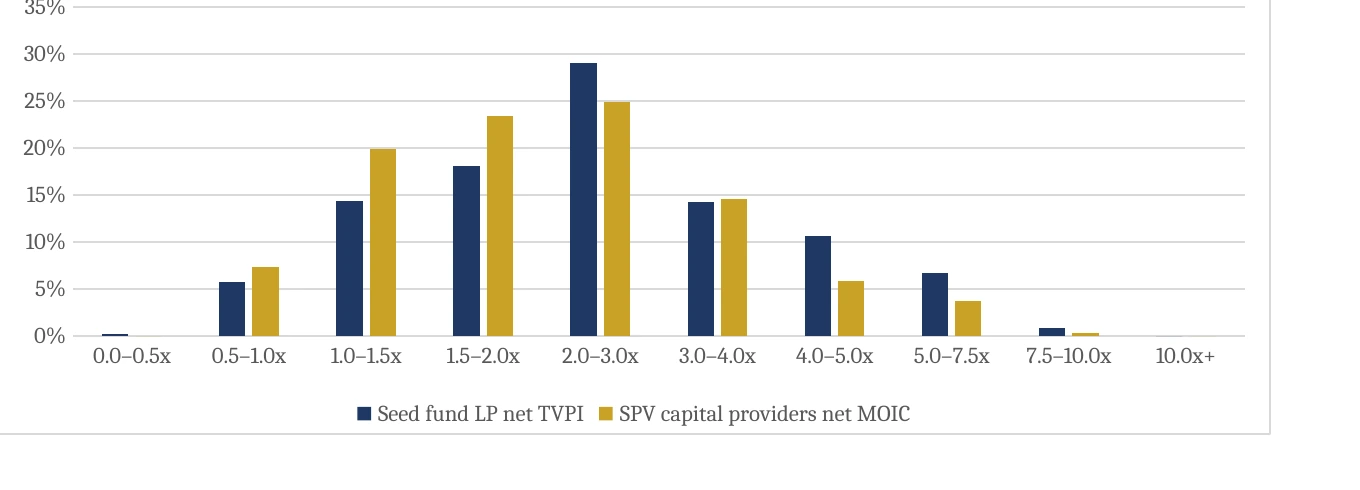
The final chart draws on 1,000 simulated portfolios, each with 25 seed companies. The SPV funds every Series A among the 30% of companies assumed to reach one; the results show how gains and costs fall across the parties. The SPV does well as a portfolio, though less well than the seed fund. It invests in about 7–8 companies per portfolio, loses money in only 7.3% of portfolios and returns 1.94x at the median. It trails the seed fund because it buys in at a price 4x higher and pays fees on every deal. Its returns are also more tightly bunched: it beats 3x in 24.5% of portfolios, against 32.4% for the fund, because the step-up in price limits how much the big winners can return to it.
The people running the deal see a different payoff. The originator gains on top of its fund carry: its SPV carry, $3.2m on average, adds about 25% to the roughly $12.8m it already earns on the fund, without any new capital. The specialist is the most stable earner, collecting about $1.75m at the tenth percentile, including fees. The original fund’s LPs receive no SPV carry under these terms. The follow-on profit shown as outside the fund is a modeled counterfactual, not a realized loss: the fund did not write those cheques.
Distribution of net multiples: Seed fund LPs vs. SPV capital providers
What the simulation can and cannot show
A single winner flatters the SPV. The 5x waterfall example returns 3.76x net to capital providers, but the simulated SPV portfolio returns 1.94x at the median. If all cash is received after seven years, that multiple implies about 10% a year. This annualized figure is my conversion, not a model output or a directly comparable quote against the 20%+ secondary-buyer target.
Entry price explains why selection matters. In the simulation, the SPV buys at four times the seed entry price, so a company that returns 3x on that earlier price yields only a 0.75x gross multiple—and a loss after fees—for follow-on investors. The model therefore supports underwriting each later cheque on its own terms, rather than automatically exercising every right.
The model’s roughly $31m of average foregone follow-on profit is a counterfactual: it assumes the seed fund could have financed the SPV’s cheques on the same terms. It shows the scale of the opportunity the fund’s LPs do not own, not a realized loss or a return they could necessarily have captured.
The averages also hinge on rare winners: only 1% of modeled companies are “fund returners.” A change to that tail assumption could materially alter the portfolio results. The specialist’s fees, meanwhile, can cushion its income even when investor returns are weak.
Who ends up with the carry
Who gets the carry comes down to the contracts. The seed fund and the follow-on SPV each have their own profit pool, and the manager can receive carry from both. The LPs’ share of any SPV upside depends on the fund and vehicle documents.
In the simulation, the seed manager receives ordinary carry on the fund’s own profit—about $12.8m per portfolio on average. Separately, SPV investors provide the follow-on capital and keep 80% of its profit; the other 20% is carry, split 50:50 between the seed manager as originator and the specialist. The assumed terms pass none of that SPV carry to the seed fund’s LPs. These are modeled allocations, not a universal rule, as the table below shows.
| Who | Average carry per portfolio | Puts in capital? |
|---|---|---|
| Originator (seed manager) | ~$3.2m | No, it contributes the access |
| Specialist | ~$3.2m (its $4.7m total minus ~$1.5m of fees) | No, it sources and runs the SPV |
| Original seed fund's investors | $0 | Their money paid for the original access |
The answer to the opening question
Under these assumed terms, the manager receives about $16m in combined fund and SPV carry per modeled portfolio, while the seed fund’s LPs receive none of the SPV carry. That is not how every pro rata deal works. It is what these funding and carry terms produce.
Three terms determine who benefits. First is the SPV carry split: this model divides the 20% carry pool equally between originator and specialist, while the SignalRank-style example assigns it to the originator. [10, 11] Second is whether the originator passes any of its share to the seed fund’s LPs. The model assumes none; a 50% pass-through would send about $1.6m back to them per simulated portfolio. Third is the fund agreement: it may require the manager to share outside carry or give the fund first claim on its pro rata rights. The economics depend on those documents, not on the right’s name.
Outside capital can solve the reserve problem without solving the LP’s ownership problem. An LP should ask whether the next cheque earns an attractive net return, who controls the right to invest, and whether any SPV carry flows back to the fund. The figures here come from a single illustrative simulation, not realized returns. Without those answers, access alone tells an LP very little.
References and evidence notes
Selected sources and further reading. Provider disclosures and practitioner commentary are self-reported or directional evidence, not independent validation.
- [1]NVCA 2026 Yearbook — Industry data — Industry data on 2025 fund formation and capital concentration
- [2]PitchBook-NVCA Q2 2026 Venture Monitor — Industry data — July 2026 industry data on first-half fundraising and AI share of deal value
- [3]SiliconANGLE Q3 2026 Venture Monitor coverage — Industry/news summary — 8 October 2026 report on fundraising, emerging managers and secondary discounts
- [4]Crunchbase News What are pro rata rights — Practitioner explainer — 16 December 2021 interviews including Alpha estimate of expired rights
- [5]Y Combinator Safe financing documents — Legal/form — Official post-money SAFE forms and optional side letter
- [6]Y Combinator Pro Rata Side Letter — Legal/form — Form text on scope, termination and assignment
- [7]Cooley Q2 2026 Venture Financing Report — Law-firm market data — 17 August 2026 deal terms including pay-to-play and down rounds
- [8]Alpha Partners How we partner with VCs — Provider disclosure — Provider process check sizes and deployment approach
- [9]Sydecar Interview with Jesse Bloom — Provider case study — 30 March 2025 operational case on SaaS Ventures
- [10]MDSV Capital Extension Program — Provider disclosure — Published programme requirements and economics
- [11]SignalRank Seed partners — Provider disclosure — Provider partner economics, timelines and scale
- [12]Alpha Partners Capital Factory and Apptronik — Provider case study — Manager published transaction case and repeated SPVs
- [13]Alpha Partners How Alpha aims to derisk venture investing — Provider case study — Manager published micro VC case and subsequent IPO
- [14]Forbes Small LP checks buy SPV leverage — Commentary/data — 9 September 2026 column on LP co-investment and SPV fees
- [15]AngelList Should Seed Investors Follow On — Research/model — Abraham Othman simulation of follow-on strategies
- [16]Sapphire Partners Dirty Secret Venture Reserves — LP research — 4 May 2022 LP analysis by Laura Thompson
- [17]Ulu Ventures Questioning the reserve fund — Manager research — Manager model comparing reserve strategies
- [18]Aalto University Follow-on investment share and VC fund performance — Academic thesis — Master’s thesis using Preqin data from 1990 to 2011
- [19]Institutional Investor VC firms inflate valuations ahead of fundraising — Academic research coverage — 2021 report on research by Turner, Zein and Pham
- [20]Jefferies Global Secondary Market Review July 2026 — Investment-bank market review — First-half 2026 secondary volume and pricing
- [21]Evercore H1 2026 Secondary Market Review — Investment-bank market review — Venture secondary volume, deal mix and return targets
- [22]Secondary Scoop Trophy hunting, not portfolio management — Secondary-market commentary/data — 2026 summary of PitchBook US VC Secondary Market Watch