Energy as the Foundation of Economic and National Power
Here is the paradox. India is rising as a geopolitical power, courted by every bloc and one of the fastest-growing large economies. Yet the average Indian has about a quarter of the energy supply of the average Chinese citizen.
India has built an enormous energy system that still delivers too little reliable, affordable, useful energy to each person and each factory to underwrite great-power ambitions. The question is whether enough energy reaches the factory floor on time, and at a price that lets Indian industry compete.
Not yet, for four reasons. First, the average Indian has about a quarter of the energy supply of the average Chinese citizen, so workers lack services that raise productivity. Second, the grid is on more often than ever, yet it still fails at the wrong moments. Third, too much electricity leaks away between plant and plug, through a network nobody has fully mapped. Fourth, India imports nearly nine-tenths of its crude oil, leaving it exposed to shocks in the Gulf.
How does a shortfall in energy become a shortfall in power? Through a chain with four links:
- Energy that is scarce, unreliable or expensive raises factory costs and lowers utilisation. This link is established: 15.4% of Indian firms report outages and almost 23% own or share a generator, although the size of the cost is not yet measured.
- Higher costs and lower utilisation weaken competitiveness. This is partly established: India’s large-industry power price is mid-table, so the case rests on reliability, which the scenarios in Part V show could matter a great deal.
- Weaker competitiveness slows capital formation, as investors build factories elsewhere. This is a hypothesis, consistent with the evidence but not yet tested for India.
- Slower capital formation limits national power. This is a historical pattern, drawn from Britain, America and China in Part I, not a law.
Most commentary on India drifts towards a familiar dashboard: the rupee, the stock market, quarterly GDP prints, the latest flow of foreign capital. These indicators matter, but they are fleeting. They shift with cycles and sentiment, and what seems decisive one quarter is forgotten the next. To see where a country is heading, you have to dig beneath them.
One layer deeper sits a more durable question: how does a nation access, use and develop its energy? Energy is not one sector among many. It is the physical foundation of prosperity — the capacity to run factories, move goods, light cities, cool homes and power data centres. Over the long run, a country's command of useful energy sets its living standards and national power.
For India, the question of power is no longer abstract. When Rishi Sunak visited India recently, the conversation turned to what kind of power the country is becoming. India's foreign minister replied, characteristically, with a quip: India is a “power in the middle”. It is a neat phrase, and it captures something real about a country that engages with every bloc while aligning fully with none.
I have spent the past decade financing and structuring energy technology deals in Europe. That work teaches you to look past the headline capacity figure to what actually reaches the customer, and when. Travelling through India this year, with the Middle East in crisis again, made the gap hard to miss.
But labels, especially self-given ones, only go so far. The harder question is: can a nation be powerful while its energy foundations remain fragile? History offers an uncomfortable answer. India's economic fortunes have long been tied to security in the Middle East. When conflict, supply shocks or price spikes disrupt the Gulf, the effects travel quickly into India's import bill, its currency, its inflation and its fiscal arithmetic. None of this is new. Policymakers have understood the vulnerability for decades, yet India’s leaders have too often left it unresolved.
The issue draws headlines and photo opportunities, but little sustained action. The agenda is long and largely unfinished:
- diversifying suppliers and fuels;
- raising energy density;
- systematically mapping and optimising the national energy portfolio;
- building strategic reserves deep enough to absorb a prolonged shock;
- developing domestic resources;
- cutting transmission and distribution losses;
- repairing the finances of distribution companies;
- scaling storage; and
- getting more useful work from every unit of energy.
This dependency matters to economists and investors alike. It caps how fast and how far India can grow. It also reveals the opportunities — in generation, grids, storage, efficiency and domestic energy resources — likely to shape the next generation of Indian winners. So here is the plan: begin with history, test India against it, and follow energy all the way from the
power plant to the factory floor.
Energy and the Historical Expansion of State Capacity
Here is a simple way to read history: power has always followed the ability to put useful work, far beyond what human and animal muscle can supply, into the hands of ordinary people.
Before we get to empires, start with what energy does. It grows and cooks our food, heats and cools our homes, pumps our water, moves people and goods, builds our cities and carries our messages. Robert Ayres and Benjamin Warr suggest thinking of an economy as a physical process: you extract, refine, transform, manufacture, use and finally discard. Capital, labour and knowledge organise that chain. Energy is what makes it run. A bakery needs more than bakers and ovens; it needs flour, water and heat. Money describes the transactions, but it does not replace the physics underneath.
The Pre-Industrial Energy Constraint
Go back a few centuries. Rome, imperial China and the great Indian kingdoms could raise armies, collect taxes and build institutions of astonishing complexity. But the engine underneath was always the same: muscle, firewood, wind and water. Vaclav Smil puts the sustained mechanical output of a working adult at roughly 100 watts. About one old-fashioned light bulb. If you wanted more work done, your options were limited: add more people, work them longer, bring in oxen and horses, or build a waterwheel wherever the river happened to cooperate. [R1]
And the land had to do everything at once. The same fields had to feed the people, feed the animals and supply the fuel. Transport was slow and expensive, so most production stayed local and seasonal. Smil estimates that keeping a large preindustrial city supplied with firewood could take an area many times the size of the city itself. Every city lived off a much larger hinterland.
So the limit was not imagination or ideology. It was physics. Roman logistics, Chinese canals and Indian textile towns were sophisticated, yet each was tied to local energy flows. These societies could coordinate on a vast scale; what they could not do was put much power behind each pair of hands. History’s great transformation broke that ceiling. It turned the worker from the source of power into the supervisor of a far bigger flow of it.
That is why the machines matter as much as the fuels. Historians of energy call them prime movers: muscles, waterwheels, steam engines, internal combustion engines and turbines. Coal sitting in the ground is just rock. Pair it with a steam engine and it becomes mechanical work; pair it with a turbine and it becomes electricity. Owning a resource is not the same as owning the machinery to exploit it, and any serious look at national capability has to examine both.
Britain: Coal, Steam and the First Industrial Breakout
Britain was the first to break out. Coal let it tap millions of years of stored sunlight, and steam let it concentrate that energy in factories, mines, ironworks, railways and ships. Suddenly, neither the number of workers nor the nearest fast-flowing river capped production. But coal alone does not explain the Industrial Revolution. Britain also had high wages that made machines worth buying, commercial opportunities that rewarded scale, and institutions that encouraged mechanisation. Energy widened what was possible; economics and institutions decided how much of it Britain used. [R1, R14]
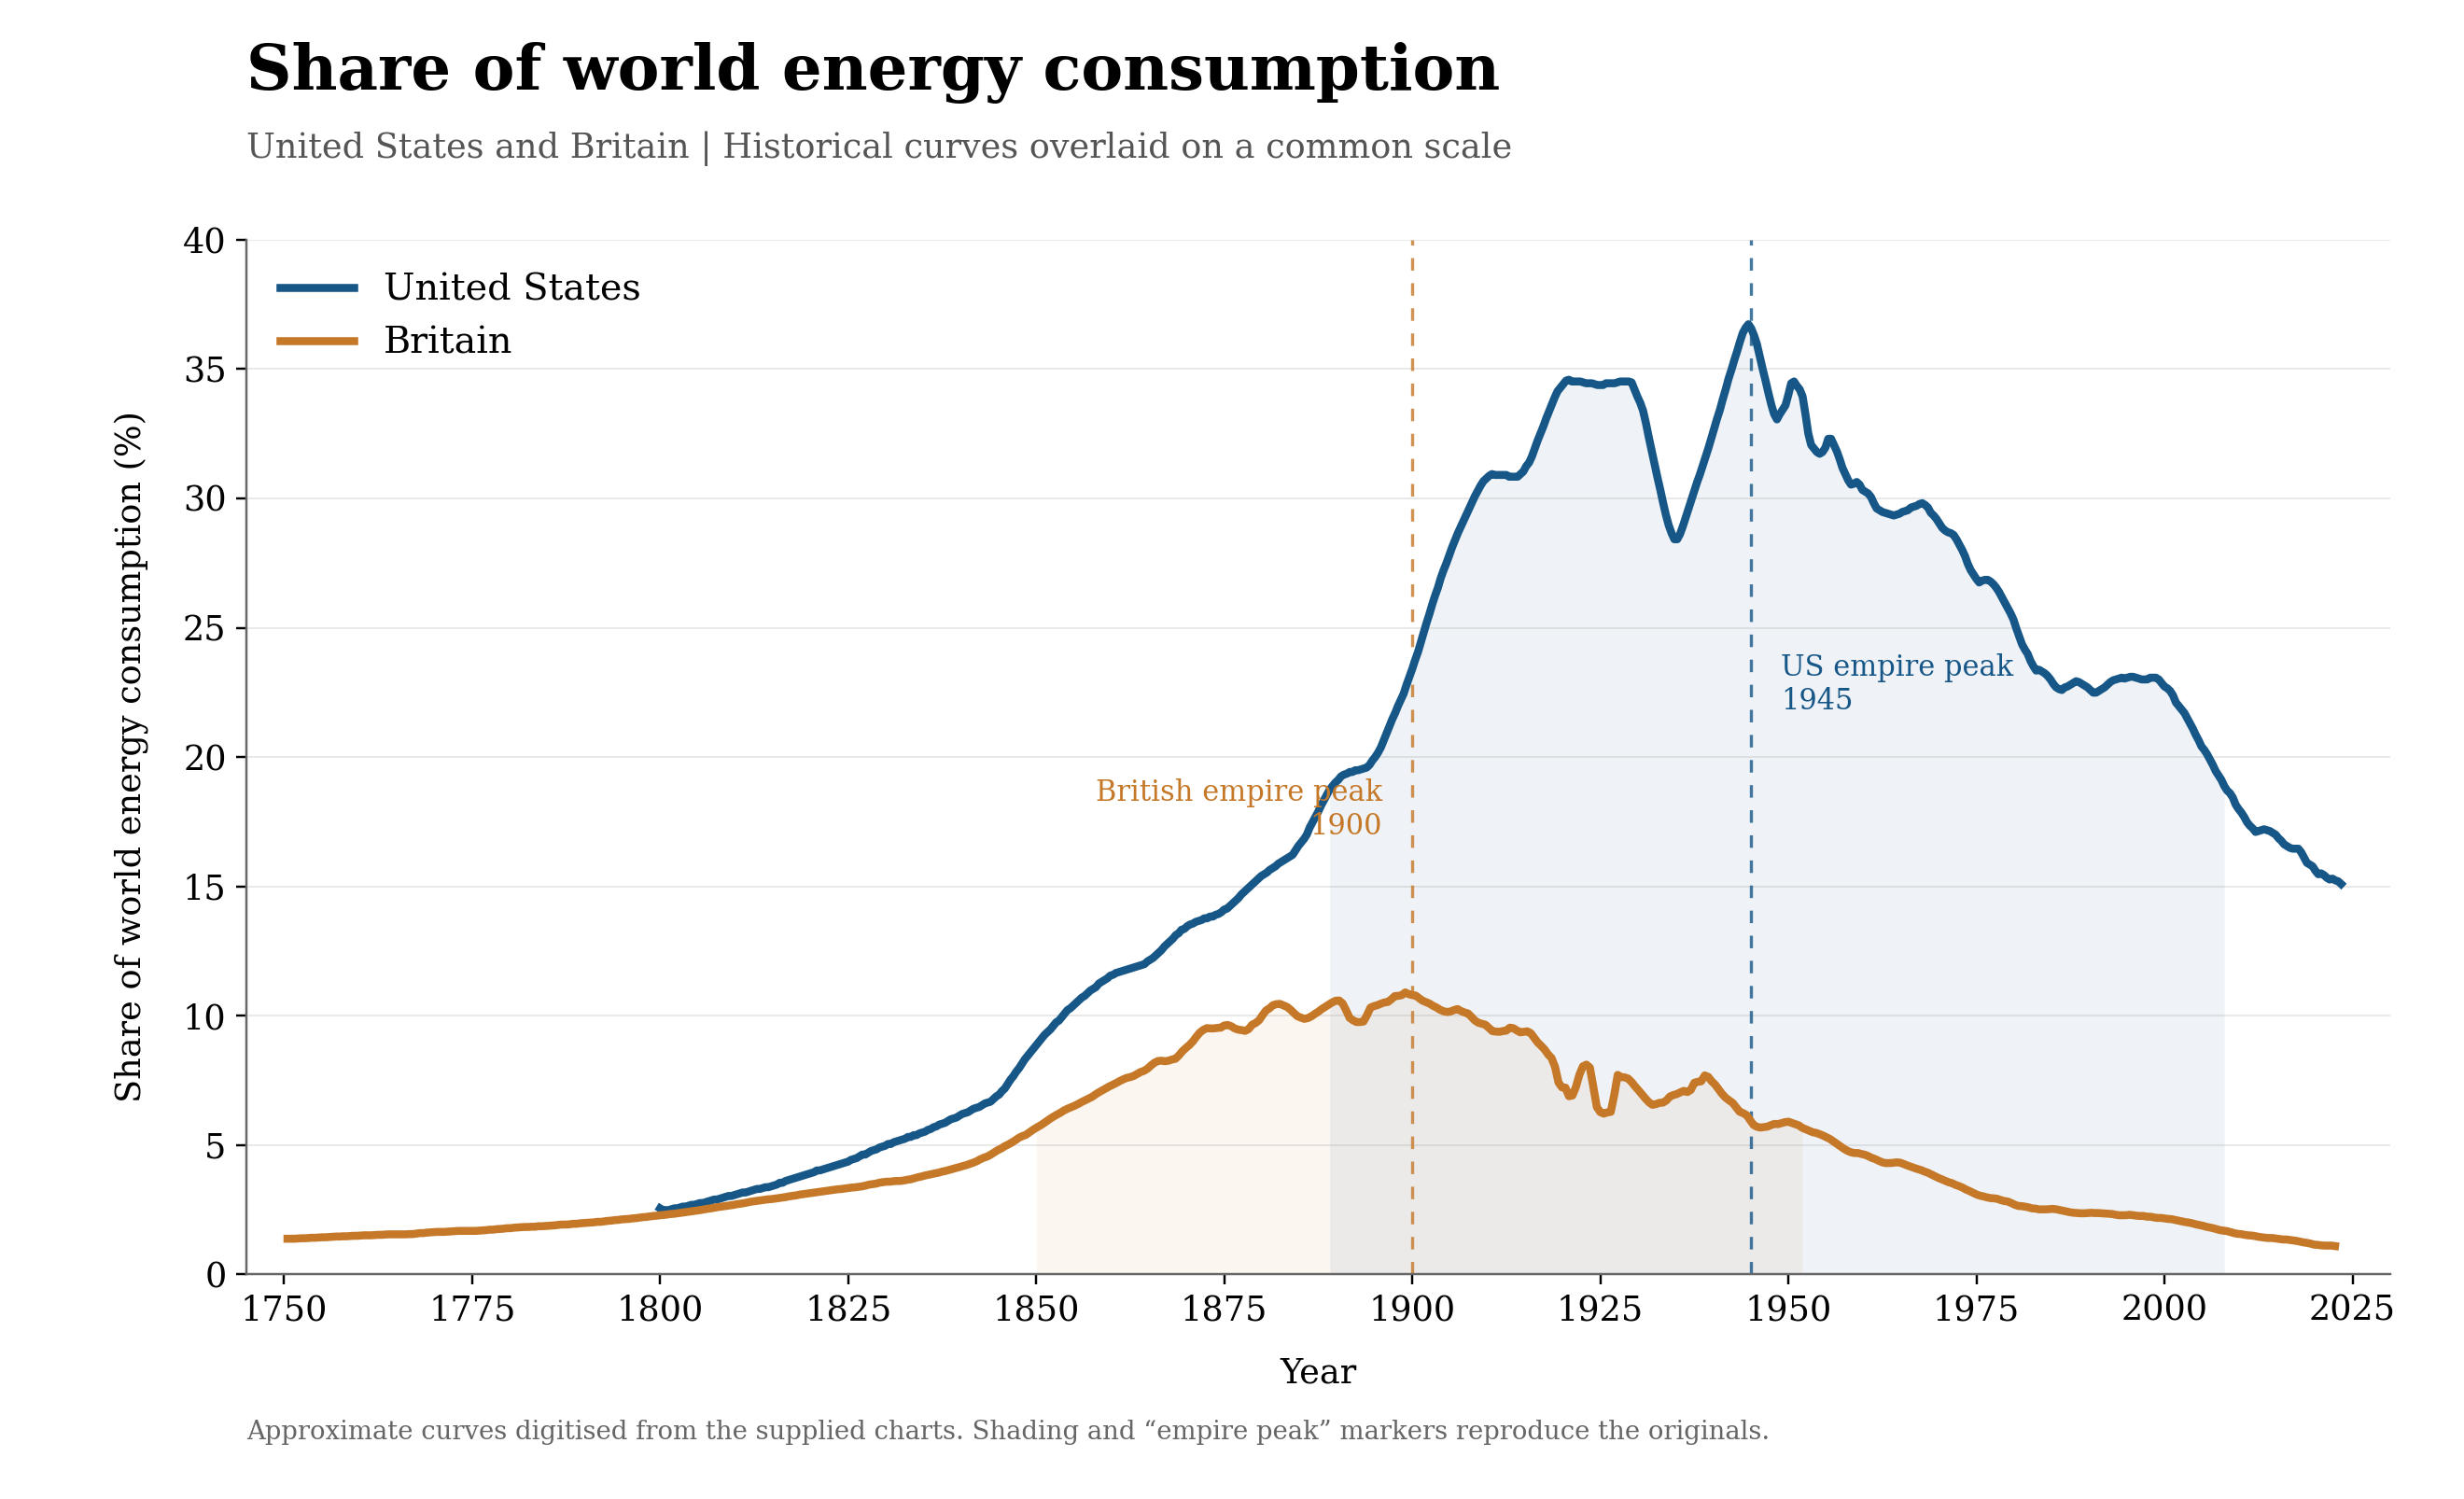
One way to gauge a country’s material weight is its share of world energy consumption. On that measure, Britain’s share peaked around 1900, and its “half life”, the period during which its share stayed above half its peak, ran from about 1850 to 1952. A century of pre-eminence, built on coal. [R16]
United States: Scaling Energy, Industry and Capital
Then America ran the same play across a continent. Coal, then oil, then natural gas and electricity all fed a vast domestic market with mass production, engineering talent and deep capital markets. Those energy flows mechanised the farm, built the car and the aeroplane, ran the steel mills and chemical plants, and supplied the logistics behind American military reach. On the same measure, the US share of world energy use peaked around 1945 at a little over one-third of the global total, with a half life stretching from 1889 to 2008. [R16] The lesson is not “have more energy”. It is abundant energy, plus the machines to convert it, plus the organisation to use it, all at enormous scale. [R1, R15]
China: Industrialisation Through Energy Mobilisation
China is a modern example on a far larger scale. China built its industrial rise on staggering additions to electricity supply and energy-hungry manufacturing. In 2024, China generated roughly five times as much electricity as India and produced about 6.7 times as much crude steel. China’s energy consumption overtook America’s in 2009, the year after America’s half life ended. Industrial capacity and energy mobilisation feed each other; causation does not run one way, from energy to power. [R4, R6, R16]
Source: national energy-share series summarised in R16. Values are approximate and intended to show long-run trajectories rather than precise annual estimates.
Energy Is Necessary, but Not Sufficient
The energy-share measure is provocative, but it leaves out a great deal: institutions, alliances, the quality of technology, financial muscle and the factories a country owns abroad. A falling share does not mean economic decline. Britain and America kept growing after their peaks; others simply grew faster. What fades is the exceptional position, not the economy. [R1, R16]
Smil puts it well: energy constrains what societies can do, but it does not determine what they choose to do. Countries with similar energy use end up in different places. The ability to mobilise reliable energy at scale is a physical precondition for industrial and military strength. Energy sets the boundaries of the possible; institutions and choices decide what happens inside them. Which brings us to India, and to the uncomfortable gap between how much energy it uses in total and how little reaches each person.
India’s Aggregate Scale Masks Low Per-Capita Energy Availability
India is big. Big population, big GDP, a big seat at the table. But size tells you nothing about how much useful energy reaches each household, each worker, each factory floor.
Aggregate Scale Versus Per-Capita Energy Availability
| Country / group | Energy supply (EJ) | Supply per person (GJ) | Electricity generated (TWh) |
|---|---|---|---|
| India | 38.8 | 26.7 | 2,030 |
| China | 158.9 | 111.9 | 10,087 |
| United States | 91.8 | 265.9 | 4,635 |
| Germany | 10.1 | 119.9 | 497 |
| Japan | 16.4 | 132.8 | 1,016 |
| South Korea | 13.2 | 254.2 | 630 |
| OECD aggregate | 217.8 | 155.5 | — |
Table 1. Energy Institute 2024 energy supply and electricity-generation figures. This supply series excludes much traditional biomass; gross generation is not delivered electricity. [R4]
Look at it per person and the picture changes sharply. The average Indian has roughly a quarter of the energy supply of the average Chinese citizen, a sixth of the OECD average and a tenth of the American. That does not mean India should burn as much as America. But the gap is a signal, and a loud one, of how many physical energy services are still missing from Indian lives. [R4]
Here is another way to see it. India accounts for about 6.4% of world energy use but only 3.4% of world nominal GDP. China looks similar: 27.7% of the world’s energy against 16.8% of its output. The United States runs the other way, with 15.0% of energy and 26.3% of GDP, and so do Germany and the UK. It points to where much of the world’s energy-intensive work is done.
Electricity Consumption and Income Are Closely Linked
Electricity and income rise together. In the 2021 data, rich countries all use substantial amounts of electricity. There is no magic 1,000 kWh line that unlocks prosperity. Electricity use and GDP both rise as a country develops, and trade lets rich countries import goods whose energy was burned somewhere else. [R17]
Source: Energy for Growth Hub, using US EIA and World Bank data (2021), R17. Historical data; GDP per capita is shown in current US dollars. The highlighted boundary is illustrative rather than causal.
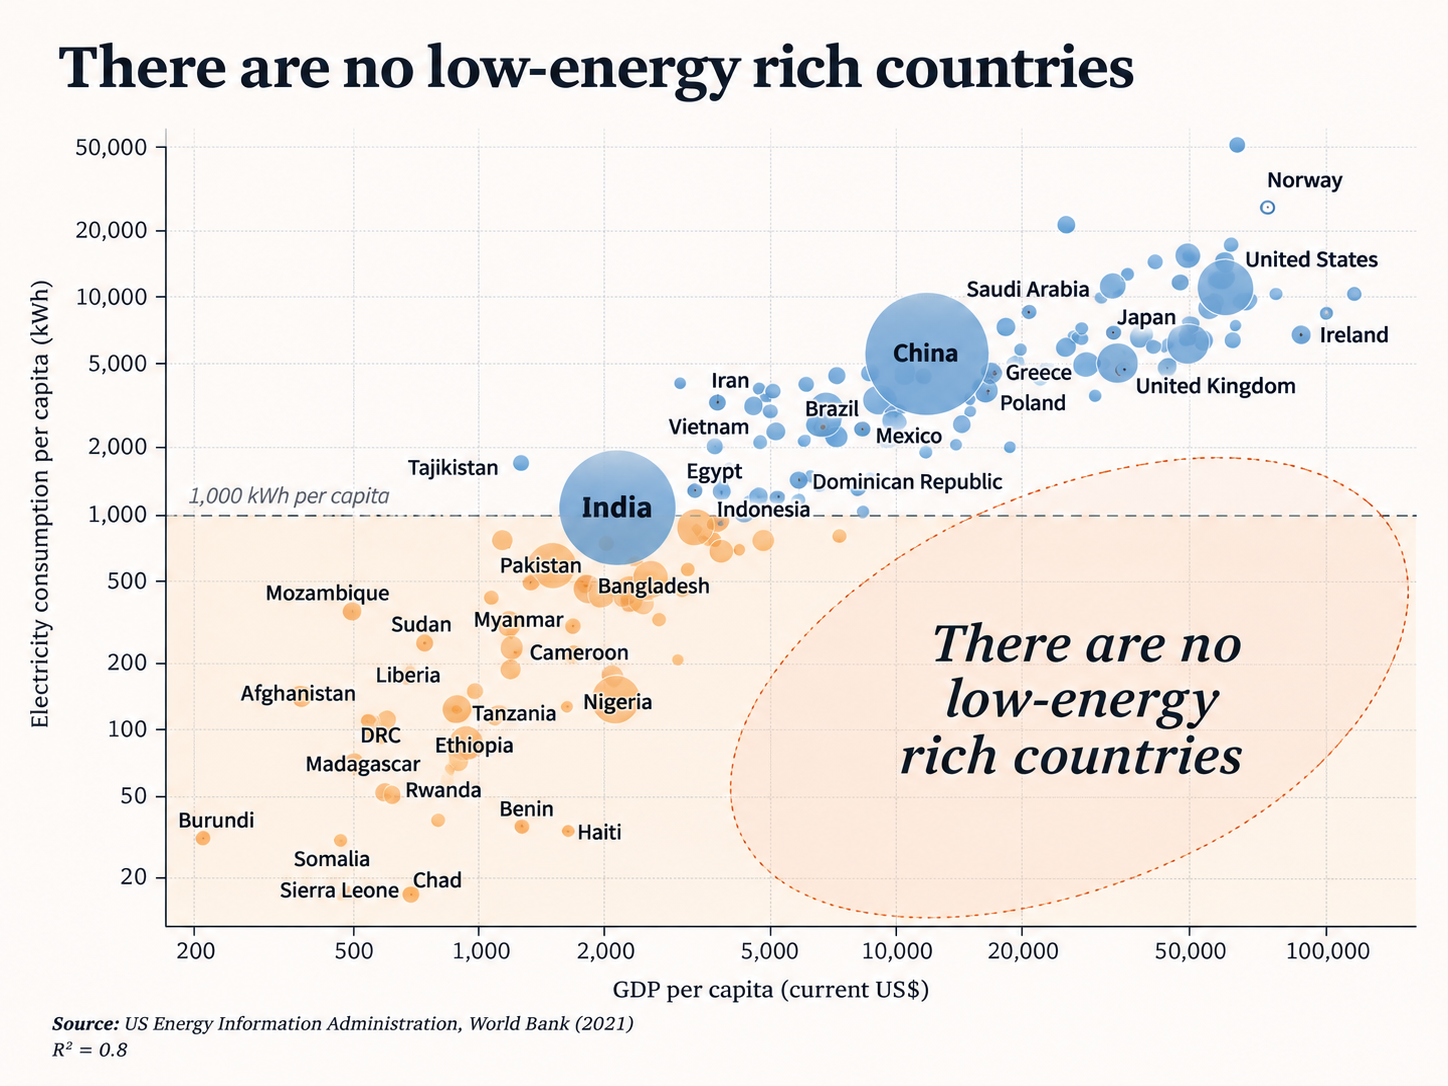
By FY2024–25, India’s electricity consumption had reached about 1,460 kWh per person. [R12]
India Remains on the Steep Part of the Energy–Development Curve
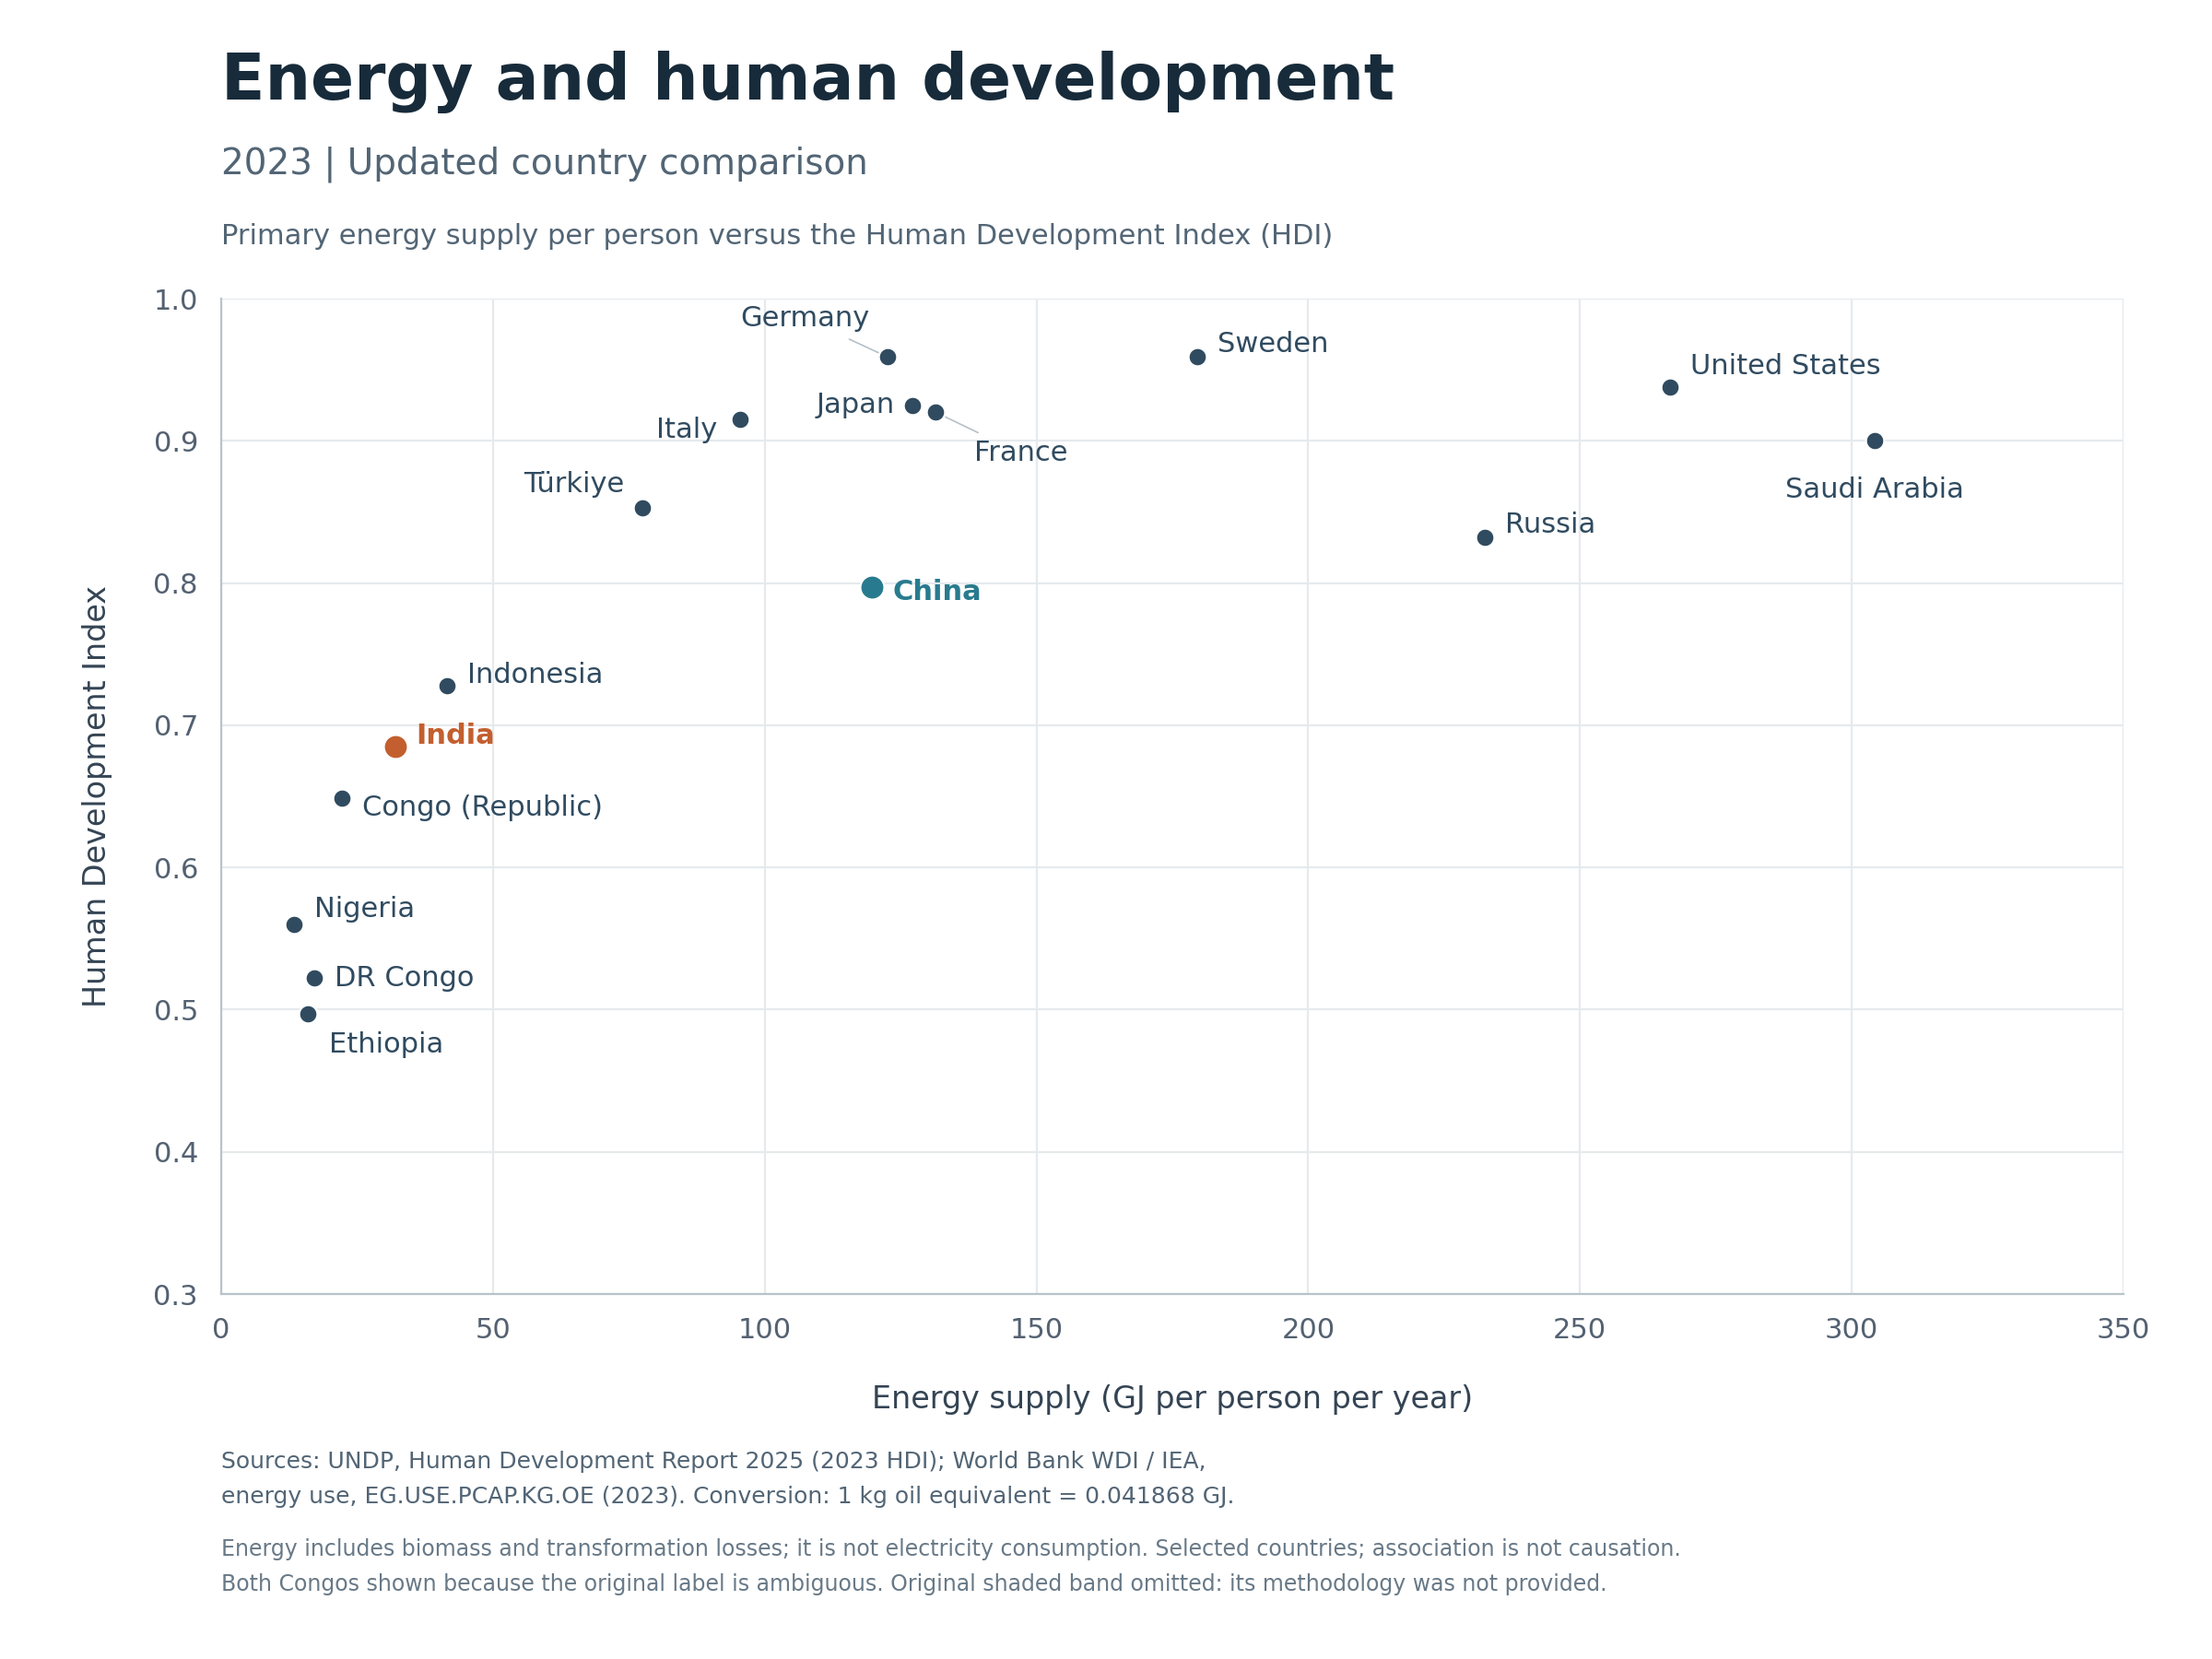
Energy buys the most development where people have the least of it. China uses nearly four times as much energy per person as India, and the US more than eight times. At low levels of energy, a little more goes a long way. At high levels, huge extra inputs buy only small gains. [R2]
Where does India sit on that curve? Its HDI of 0.685 places it in UNDP’s medium human development category for 2023, right on the steep part of the curve, where extra energy services still change lives. The good news is that India does not need to copy America to climb. Italy and Germany reach high human development on far less energy per person than the US. But a national average hides who benefits. Reliable refrigeration for a rural clinic, affordable cooling for a poor household or dependable power for a small manufacturer does far more for development than one more air conditioner in an already comfortable home.
Source: UNDP and World Bank data, 2023 comparison. Cross-country values are indicative because primary-energy accounting conventions differ.
Industrial Output Provides a Clearer Measure of Physical Capacity
| Country | 2024 GDP/person, PPP current intl $ | 2024 crude steel (Mt) |
|---|---|---|
| India | 11,160 | 149.4 |
| China | 27,105 | 1,005.1 |
| United States | 85,810 | 79.5 |
| Germany | 73,552 | 37.3 |
| Japan | 52,039 | 84.0 |
| South Korea | 61,051 | 63.6 |
Table 2. World Bank/UNdata and World Steel Association data for 2024. [R5, R6]
Physical output tells a clearer story than currency. China made about 6.7 times as much crude steel as India in 2024, and steel is energy made solid. Steel output makes industrial capacity more tangible. What you should not do is divide GDP by energy and call it an efficiency ranking. Exchange rates, prices, industrial mix and the energy embedded in imports all distort that ratio.
It also helps to remember what each industry needs. Steel needs heat, electricity and reducing agents. Aluminium needs huge, uninterrupted flows of electricity. Fertiliser needs feedstock and process energy; cement needs kiln heat, power and freight. General manufacturing needs reliable power and process heat, and digital services need continuous power and cooling. For each of them, the useful comparison is not GDP but energy cost and continuity per tonne, per unit or per hour of uptime.
Useful Work Matters More Than Gross Energy Input
Ayres and Warr draw a line between the energy you put in and the useful work you get out. A country can burn plenty of fuel and still not get comparable mobility, heat, factory output or wellbeing. Think of it as a relay race, from fuel to power plant to wires to machine to finished product. Energy gets dropped at every handover, through losses, poor technology or weak institutions. [R3]
Three questions matter: who gets it, when do they get it, and what does it let them produce? Two countries can burn the same fuel and get very different amounts of real work out of it. A newly electrified clinic, a reliable irrigation pump and a production line that never stops are worth far more than the same energy burned in a wasteful boiler.
Grid Availability Does Not Guarantee Industrial Reliability
Reaching each person is one test; reaching each factory, reliably, is another. A factory needs electricity at the right voltage, at the right frequency, without interruption, and on a schedule it can trust.
Urban Reliability: Frequency and Duration of Outages
Start with a simple question: how often does the power go off, and for how long? In 2020, Delhi saw about 2.6 outages lasting 4.6 hours in total; Mumbai saw about two outages lasting under three hours. [R7]
Source: World Bank Doing Business 2020, R7. City and utility-area benchmarks across 13 countries; reporting thresholds and geographic coverage vary.
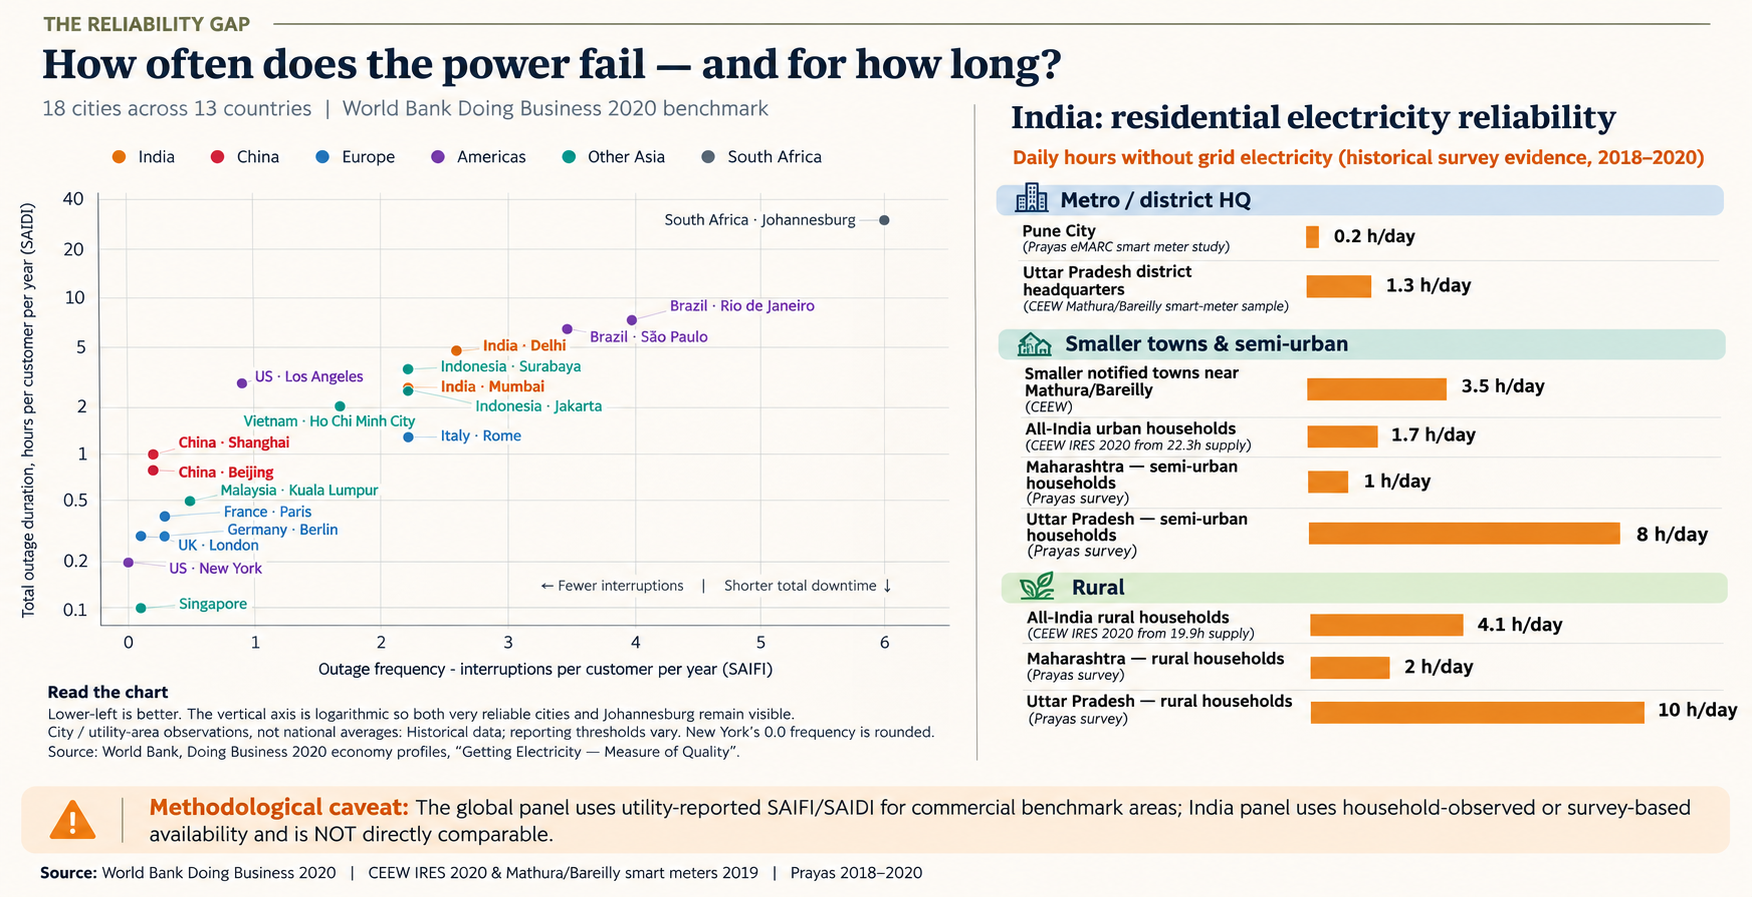
Why does the split matter? Because frequency and duration are different problems. Two grids can trip the same number of times, yet one restores power in minutes and the other in hours. These are 2020 city snapshots, but the point holds.
Indian Firms Report Materially Higher Outage Exposure Than Chinese Firms
| Economy | Firms reporting outages | Survey year |
|---|---|---|
| China | 3.7% | 2024 |
| South Korea | 5.0% | 2024 |
| Japan | 10% | 2025 |
| Indonesia | 12.7% | 2023 |
| Thailand | 13.2% | 2025 |
| India | 15.4% | 2025 |
| Malaysia | 22.3% | 2024 |
| Vietnam | 43.0% | 2023 |
| Bangladesh | 71.4% | 2022 |
| Nepal | 75.8% | 2023 |
Table 3. World Bank Enterprise Surveys, IC.ELC.OUTG.ZS; most recent survey per economy, with different reference years and sampling frames. Percentages indicate firms reporting outages, not percent of time without power. [R8]
Firms confirm the gap. In the World Bank Enterprise Surveys, 15.4% of Indian firms reported outages, against 3.7% in China and 43.0% in Vietnam. The survey does not show outage duration.
National Supply Adequacy Can Mask Local Reliability Failures
Here many headlines go wrong. In FY2024–25, just 0.1% of energy demand went unmet nationally, real progress against India’s long history of chronic shortage. Average daily supply also reached about 22.6 hours in rural areas and 23.4 hours in urban areas by FY2024–25/FY2025–26. Both are real, and neither tells a factory manager what matters most. [R9, R12]
The national ledger can show almost no shortage while an individual feeder still trips on faults, goes down for maintenance, chokes on local congestion, sags in voltage or faces scheduled cuts. And an average of more than 22 hours of supply says nothing about whether the missing hour landed in the middle of a factory’s critical shift.
Industrial Outages Impose Three Distinct Cost Layers
What does an outage cost a factory? Three things. First, replacement energy: diesel or gas generators and UPS systems. Second, lost production: idle workers, scrapped material, restart time and missed deliveries. Third, capital tied up in redundancy and extra inventory, just in case. In steel, chemicals or aluminium, one trip can ruin a whole batch.
Nobody publishes those costs factory by factory. Part V tests the size of that gap.
Transmission and Distribution Losses Remain Structurally High
Even when the power is on, not all of it arrives. Missing electricity is not always lost in old wires. Sometimes nobody bills it, or nobody pays.
India’s Network Losses Remain Far Above China’s
| Economy | T&D losses, % of output | Reference year |
|---|---|---|
| India | 14.5% | 2024 |
| Vietnam | 6.7% | 2024 |
| Germany | 5.1% | 2024 |
| United States | 4.6% | 2024 |
| China | 3.1% | 2024 |
Table 4. World Bank WDI EG.ELC.LOSS.ZS, 2024; values matched to the WDI-based country dashboard. Includes transmission, distribution and pilferage under its definition. not equivalent to Indian AT&C losses. [R10]
On this World Bank measure, India loses 14.5% of its electricity in transmission and distribution, roughly 4.7 times China’s 3.1%. Some of that is accounting. The grid leaks, physically and commercially. [R10]
Commercial Losses Are Improving but Still Constrain Utility Economics
A better measure counts every unit that never turns into cash. Think of a shop: some stock breaks in the storeroom, some walks out unpaid, and some customers never settle their bills. Utilities call this AT&C loss, and it counts all three. Here the story is encouraging. Nationally, it has fallen from 21.91% in FY2020–21 to 15.04% in FY2024–25, nearly seven points in four years. Real progress, but the remaining losses still starve utilities of cash. [R11]
| State | AT&C loss, FY2024–25 |
|---|---|
| Kerala | 6.61% |
| Delhi | 6.56% |
| Gujarat | 7.80% |
| Tamil Nadu | 10.96% |
| Maharashtra | 16.90% |
| West Bengal | 16.96% |
| Uttar Pradesh | 19.26% |
| Madhya Pradesh | 22.76% |
| Jharkhand | 28.19% |
| Nagaland | 48.86% |
Table 5. Ministry of Power, state AT&C annexure published February 2026; aggregation across private/public utilities differs from some utility-specific tables. [R11]
Across states, the differences are dramatic. The causes range from old wires to theft, poor metering and weak collection. Each state needs a different fix.
India Lacks a Comprehensive National View of Grid Asset Age and Condition
For a close-up of the physical problem, look at a January 2026 CEEW study of a single mixed-load feeder in Uttar Pradesh. It lost about 7% of its power in the local wires alone, three to four times what a well-run line should lose. The culprits: old wires, a long line, farm pumps and overloaded transformers. One feeder, but a familiar story. [R13]
| Observed weakness | Mechanism | Industrial consequence |
|---|---|---|
| Old / undersized conductor | Higher resistance and thermal loss | More energy needed for same delivered kWh |
| Long low-voltage feeder | Higher current for given power transfer | Voltage drop, losses and service degradation |
| Overloaded transformer | Heating, stress and accelerated deterioration | Higher probability of interruption and repair |
| Network congestion | Local inability to serve peaks and new loads | Restricted connections and production flexibility |
| Weak metering / monitoring | Losses and faults hard to locate | Collection risk and slower restoration |
What about the whole network? The national picture is harder to read. India has reasonably good national data on how much grid it has, and increasingly useful utility-level data on how often equipment fails. There appears to be no single publicly accessible national asset register: one place that records, for every utility, when each asset was commissioned, what condition it is in, how hard it is worked, how often it has failed and when it needs replacing. Instead, the evidence is scattered across utility ratings, regulatory filings and investment programmes.
Start with the sheer size of the thing. As of July 2026, the scale of India’s grid was striking. [R28]
Half a million kilometres of high-voltage lines. Some 14 million kilometres of local lines, enough to wrap around the Earth about 350 times. That is the scale. It tells you nothing about the grid’s health.
For a measure of grid health, look at transformer failure rates utility by utility. The national average fell from 6.40% in FY2023–24 to 5.02% in FY2024–25, in a single year. A real improvement. [R29]
Behind the average, the spread between utilities is wide. Among the utilities REC rates, HESCOM in Karnataka reports an unusually high failure rate, while utilities such as BSES Rajdhani sit at the other end of the range. The causes range from age and overloading to heat, dust and weak maintenance. Either way, asset management varies enormously from one utility to the next. [R29]
Then there is visibility. As of 31 March 2026, India had almost 16 million distribution transformers, and fewer than half had a meter. [R30]
On almost 9 million of them, the utility cannot see how much power flows through or where it leaks. It is hard to manage what you cannot see, and harder still to plan the replacement of assets whose load history you do not know. The government’s smart-metering drive exists to close this gap, which is why its delivery matters so much.
In short: we know how big India’s grid is. We are starting to know how often parts of it fail. We still lack a national picture of its age and renewal cost. For a country whose ambitions rest on that network, that is a remarkable blind spot.
Generation Capacity Is Not the Same as Delivered Electricity
Source: underlying electricity-flow accounting. The diagram uses a different reference year and accounting boundary from the 2024 national supply series.
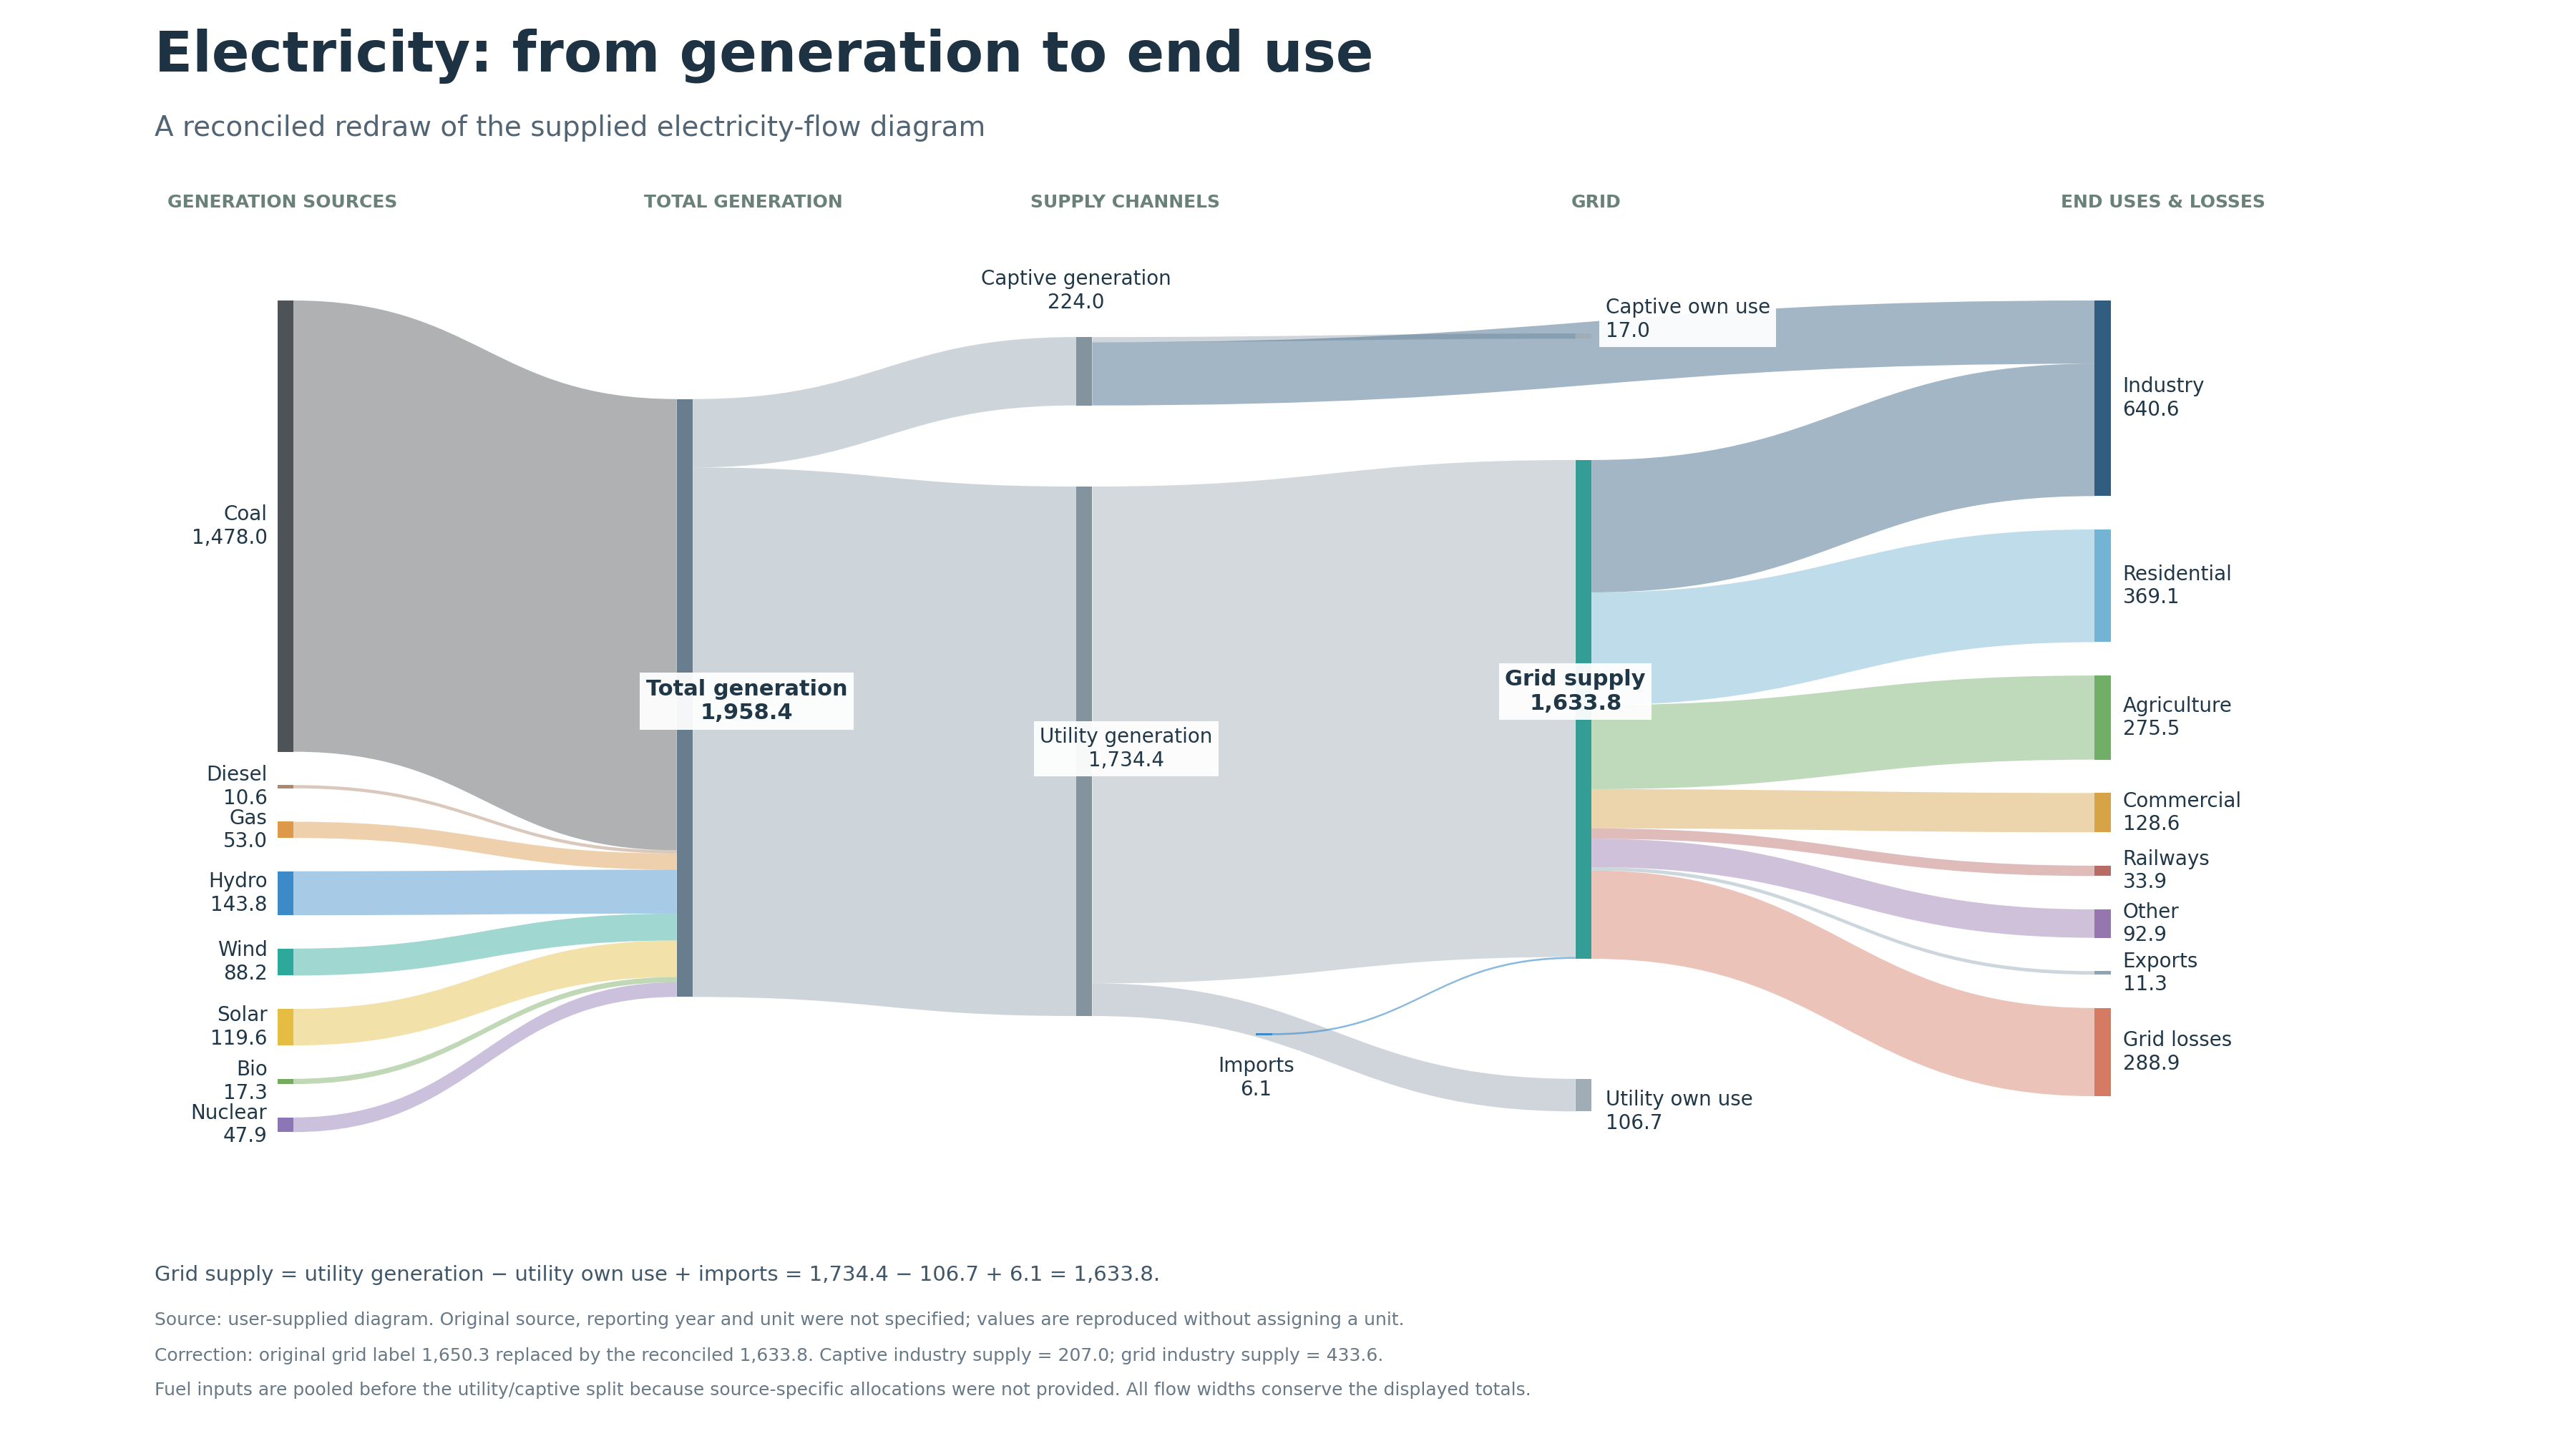
Picture the system as a chain: power plants, long-distance lines, local wires and, finally, the customer. Break any link and less useful energy reaches homes and factories. So power stations built without the wires to carry their output can leave new plants waiting for connections, or stranded altogether.
Industrial Growth Also Requires Land, Networks and Spatial Coordination
Source: literature estimates of source-area power density and demand-site concentration. Values are indicative medians from 2018 literature rather than current technological limits.
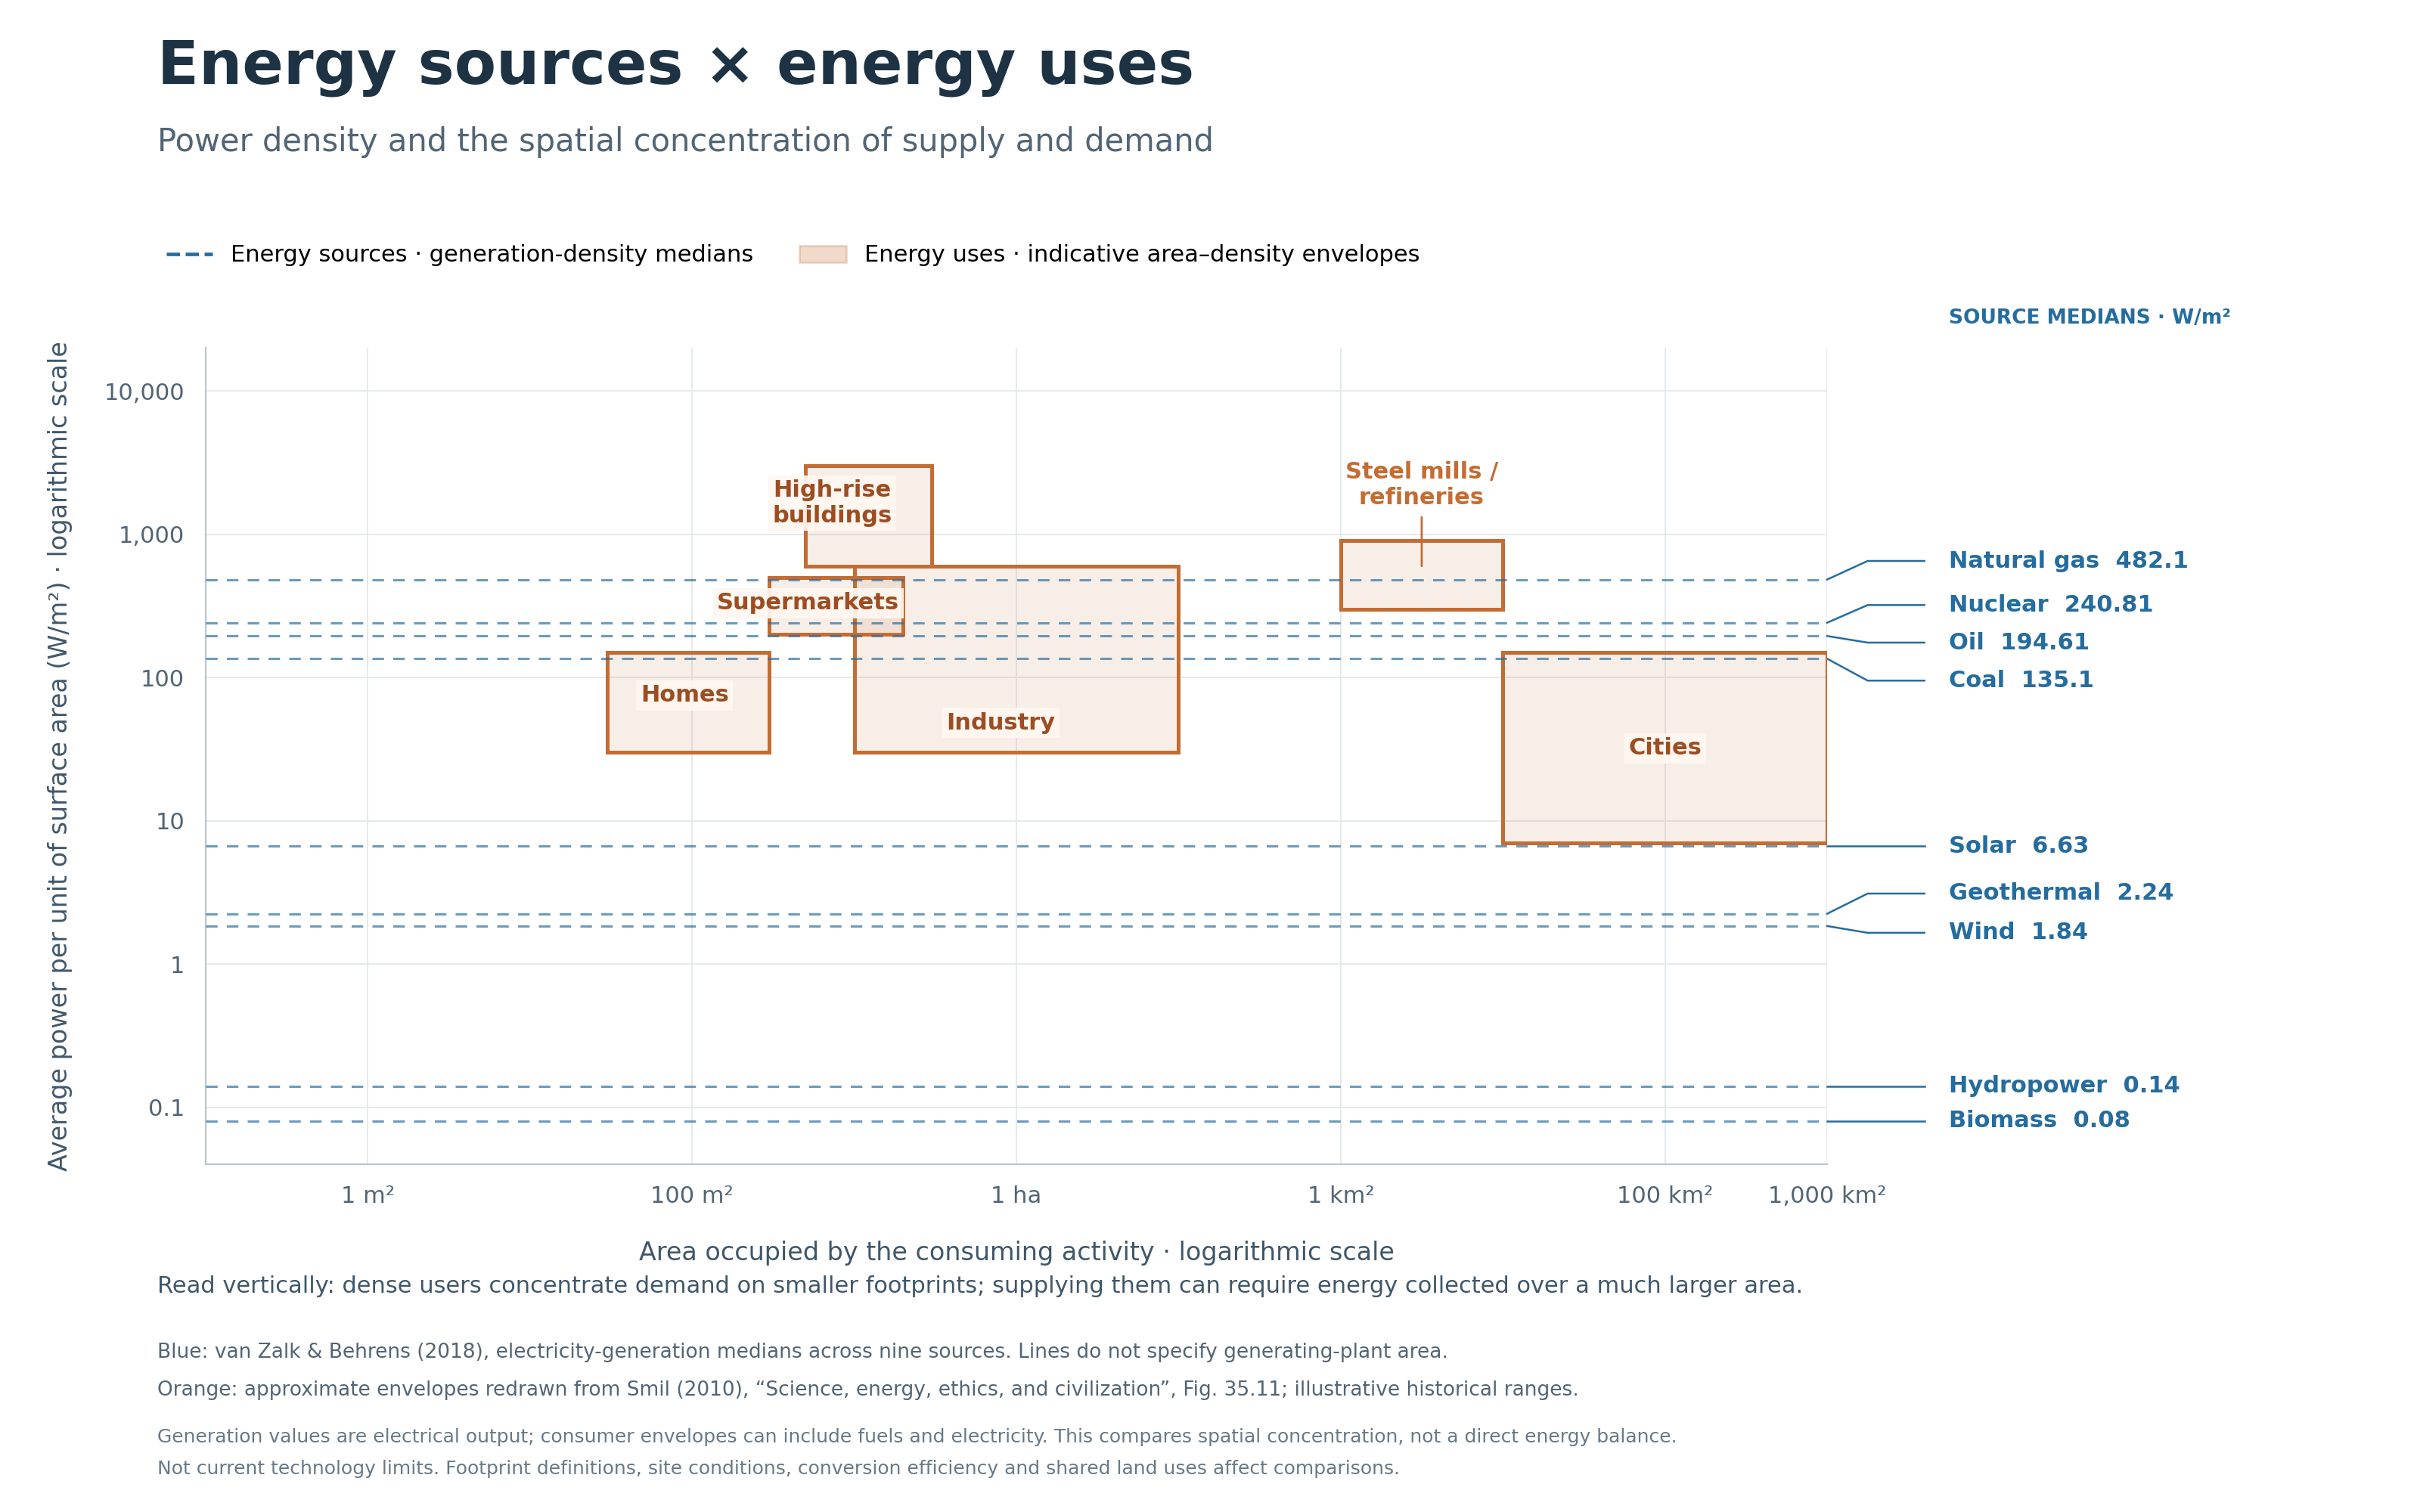
Then there is geography. Factories and cities consume power in dense spots, while solar and wind farms spread across wide areas. The real challenge is linking the two: getting power from where it is made to where it is used, even when the sun sets or the wind drops. [R1, R4]
Two ideas help. Energy density is how much energy a fuel packs into each kilogram: oil carries about twice as much as dry wood, which is why it moves trucks and planes. Power density is how much power a source delivers from each square metre of land. A 2018 estimate suggests that a solar farm matching the steady output of one large power station would cover about 150 square kilometres. Today’s panels do better, but the point stands.
For India, four things follow. First, industrialisation needs a bigger energy hinterland: steel plants, manufacturing clusters and growing cities draw on supply far beyond their own boundaries. Second, land becomes part of energy economics, competing with farming, housing and ecosystems; rooftops help, but a tall building has far more floor space than roof. Third, generation has to be matched by delivery and reliability, connecting dispersed supply to concentrated demand even when output fluctuates. Fourth, efficiency is the cheapest infrastructure of all: better buildings, cooling, motors and industrial processes deliver the same service with less generation, fewer wires and less land.
India’s Industrial Power Price Is Competitive; Reliability Remains the Open Question
Outages and losses end up in one place: the factory’s cost per tonne. For a manufacturer, the tariff per kilowatt-hour is not the whole bill. It is the energy cost of every unit you can sell, including the cost of power that fails to arrive when you need it.
Headline Tariff Comparisons Are Incomplete
Comparing industrial tariffs across countries is harder than it looks. What a factory pays depends on how much it uses, when, where it sits and which taxes and fees apply. A small workshop and an aluminium smelter are different customers. Lump them together and you learn nothing.
Large Indian Industrial Users Remain Cost-Competitive With Europe
What does the best evidence say? The IEA’s Electricity 2026 analysis finds that, even after prices eased following the energy crisis, energy-intensive industries in the European Union paid on average roughly twice US levels in 2025, and more than 50% above China and India. So India’s big industrial users are not paying the punishing prices many people assume. [R18]
Then why do so many Indian manufacturers complain about power? Because the wider manufacturing base may be a different story. Smaller plants, state tariffs and the cost of coping with unreliable supply all change the picture. That is where the real disadvantage hides.
The Relevant Metric Is Energy Cost per Unit of Saleable Output
Here is the measure I would use: everything a factory spends on energy, including backup power and the output it loses to outages, divided by the tonnes it can actually sell.
For industries that run around the clock, the cost of unreliability can swamp any difference in the tariff.
| Industrial sector | Energy need | Best factory-gate yardstick |
|---|---|---|
| Steel | Process heat, electricity, reductants | Energy-related cost and GJ per tonne |
| Aluminium | Large continuous electricity load | USD/kWh delivered and USD/tonne |
| Cement | Kiln fuels, electricity, freight | Fuel + power per tonne cement |
| Fertiliser | Feedstock and process heat | Feedstock-linked cost per tonne |
| General manufacturing | Motors, lighting, heat, uptime | Energy cost per saleable unit; outage hours |
| Data centres | Continuous electricity and cooling | Power+redundancy cost per useful IT load |
To settle this properly, I would do the following. Pick steel, textiles, chemicals and electronics factories in comparable industrial clusters in India and abroad. Record 12 months of metered energy, tariff components, interruption hours, backup running costs, utilisation and output. Then compare the full distributions, not unweighted national headline averages.
Nobody publishes real factory accounts, so I built an illustrative matched-factory model. Treat every number it produces as a sensitivity test, not a measurement. The idea is simple: build the same factory and drop it into five places. India, China, Vietnam, Germany and the United States. Then ask one question: what does electricity cost per tonne of product you can sell?
Four factories, chosen because they lean on electricity in different ways: an electric-arc steel plant, a cement plant, a cotton ring-spinning mill and a plastics injection-moulding operation. Each is large and runs almost all year. Into each country I feed its 2025 industrial power price and a real local reliability record.
Those reliability records matter. The Adani-run Mundra distribution utility stands in for India, a well-performing industrial network, not the national average. The other countries use their own city or national records.
| Data point | India | China | Vietnam | Germany | USA |
|---|---|---|---|---|---|
| Large-industry power price (USD/MWh) | 70 | 65 | 71.7 | 105 | 50 |
| Outage hours per year (utility proxy) | 2.62 | 1.99 | 3.83 | 0.20 | 2.09 |
| Outage events per year (utility proxy) | 1.59 | 0.65 | 1.95 | 0.35 | 1.08 |
| Firms owning or sharing a generator (%) | 22.7 | 5.8 | 16.7 | 5.5 | 20.5 |
Table 6. Model inputs: 2025 industrial power prices (IEA), local outage records and the share of firms with generators (World Bank). [R31]
And here is what comes out.
| Matched factory | India | China | Vietnam | Germany | USA |
|---|---|---|---|---|---|
| Electric-arc steel | 38.70 | 35.82 | 39.72 | 57.70 | 27.63 |
| Cement (integrated, electricity only) | 6.00 | 5.57 | 6.16 | 8.97 | 4.29 |
| Cotton ring spinning (40s count) | 384.56 | 356.85 | 394.11 | 576.01 | 274.63 |
| Plastics injection moulding | 113.91 | 105.68 | 116.75 | 170.53 | 81.35 |
Table 7. Modelled electricity cost plus outage-related output loss, USD per saleable tonne. Illustrative model, not real factory accounts. [R31]
Three things jump out. First, the ranking is the same in every industry, because price does most of the work. India comes in about 8% above China, roughly in line with Vietnam, about a third below Germany and about 40% above the United States (Texas). On price alone, India is mid-table.
Second, and this surprised me: in the model, outages hardly register. At Mundra, the Indian steel plant loses about ten hours of production a year to outages and restarts. That adds less than 1% to the cost of each tonne. But in every case the outage penalty is a rounding error next to the price.
Does that mean reliability does not matter? No. The model is only as harsh as its inputs. Mundra is one of India’s best-run industrial networks. The model counts only full blackouts. It leaves out voltage dips, wasted batches and the cost of owning and running backup generators. Indian manufacturers complain about those costs most.
The data hold a clue that the real picture is worse. Look at the last row of Table 6. Nearly 23% of Indian firms own or share a generator, against fewer than 6% in China and Germany. Firms do not buy generators for fun. They buy them because they do not trust the grid they are connected to, which is usually not Mundra. Steel, cement and textile mills also run their own power plants on a vast scale. But that is a lot of industry deciding to make its own power. [R32]
A well-run Indian utility is not the problem. Most Indian factories are simply not on one, and the costs they bear, in backup power, power-quality damage and lost batches, are the ones no public dataset yet captures.
So I stress-tested it. Keep the same Indian factories and the same power price, but change the grid they sit on. Scenario A is the Mundra record. Scenario B is a moderately unreliable grid: 25 outage hours and 15 trips a year, with 5% of electricity bought from diesel backup. Scenario C is a severely unreliable one: 150 hours and 60 trips, with 15% from backup. I assume backup power costs about three and a half times grid power.
| Matched factory (India) | A: Reliable grid | B: Moderately unreliable | C: Severely unreliable |
|---|---|---|---|
| Electric-arc steel | 38.70 | 46.09 (+19%) | 66.80 (+73%) |
| Cement (electricity only) | 6.00 | 6.99 (+17%) | 9.55 (+59%) |
| Cotton ring spinning | 384.56 | 439.71 (+14%) | 568.33 (+48%) |
| Plastics injection moulding | 113.91 | 130.72 (+15%) | 171.21 (+50%) |
Table 8. Illustrative reliability scenarios for the Indian matched factory, USD per saleable tonne (electricity spend plus lost contribution). Scenarios as described in the text; assumptions, not observations. [R31]
The ranking flips. On a moderately unreliable grid, the Indian steel plant costs about 46 USD a tonne, above China (36) and Vietnam (40) on their own reliability records. On a severely unreliable grid it costs about 67 USD, more than Germany (58), the most expensive country on price. Unreliability, not price, could decide whether an Indian factory is competitive. Factory-level fieldwork should test that hypothesis.
Closing that gap needs fieldwork, not more modelling: a year or more of real bills, outage logs and production records from about 200 factories. It is a big ask. But until someone does it, every claim about India’s factory-gate energy disadvantage, including mine, is an informed estimate.
Strategic Autonomy Depends on Energy Infrastructure
Behind cost sits a larger question: security. In a crisis, energy security is not a slogan. It comes down to money, alternative supply routes, domestic production, reserves in the tank and infrastructure that holds up under stress.
India’s Crude-Oil Dependence Remains a Strategic Vulnerability
Back to where we started: the Middle East. On the government’s own consumption-based definition, India imported 88.2% of its crude oil in FY2024–25. Put that next to its peers. China imported about 11.1 million barrels of crude a day in 2024, Japan was only about 16.4% energy self-sufficient in FY2024, and the United States was a net energy exporter in 2024. But the direction is clear: of the major economies, India is among the most exposed to oil it does not control. [R20–R23]
What does that exposure look like? Every barrel brings with it global price swings, a foreign-exchange bill, dependence on a handful of suppliers and passage through the same maritime chokepoints everyone else uses. Buying from more countries helps, but it cannot help much if the cargoes all pass through the same strait. Real security means alternative logistics, reserves deep enough to ride out a shock, demand that can flex, and the financial muscle to keep paying for imports when the rupee is under pressure. This is the agenda I said had been left to sleep.
System Expansion Is Outpacing Its Weakest Links
Let me be fair; the story is not all gloom. India has made real progress. Official figures put electricity generation at 1,829.69 billion units in FY2024–25, consumption at 1,460 kWh per person, and rural supply at close to 22.6 hours a day. The national energy deficit was about 0.1%. Those numbers deserve credit, and anyone who still describes India as a country without electricity is out of date. [R9, R12]
The catch is that everything has to happen at once. Industrial demand is rising, cities need cooling, renewables must be integrated, new transmission corridors must be built, worn-out distribution must be replaced, and utility balance sheets must be repaired. The IEA’s 2025 country review put numbers on the strain: renewable projects paying financing costs about 80% above advanced economies, distribution companies owing generators more than USD 9bn in March 2025, and 60 GW of renewables held back by insufficient transmission. They show where the chain is weakest. [R24]
Approved Investment Must Translate Into Commissioned Infrastructure
So what is India doing? The flagship is the Revamped Distribution Sector Scheme (RDSS), which pays for grid repairs and smart meters, with money tied to results. By 2026 it had sanctioned close to INR 3 lakh crore of repairs and meters. Big numbers. But remember: sanctioned is not built, and money announced is not wires replaced. The figures also say nothing about the age of the equipment already in the ground. [R25]
Here the Uttar Pradesh feeder study earns its place. It shows that money must go to specific lines and transformers, not be sprinkled across the map. Each tool fixes a different problem. Smart meters plug billing leaks. New wires cut leaks. Automation and spare capacity cut outages. Use the wrong tool, and you get a headline but not a better grid.
Distribution Economics Remain Constrained by Political Trade-Offs
Politics sits underneath all of this. Governments ask distribution companies to reconcile competing demands: keep household power cheap, support farmers, stay competitive for industry, remain solvent and still invest for the long term. Cross-subsidies, late subsidy payments, tariff freezes, high losses and weak collections can feed on each other in a vicious circle. Cash runs short, so maintenance slips. The network deteriorates, so losses rise and service worsens. Industry responds by buying diesel generators or moving elsewhere. The circle differs from state to state, and the recent fall in AT&C losses and shortages proves it can be broken. But breaking it takes political will, not just another scheme launch.
Three Stress Tests for Indian Energy Resilience
Before closing, three stress tests I would run on any claim about Indian power. Each one turns a slogan into a measurable question.
- Fuel shock. Oil prices spike and the rupee falls at the same time. Follow the pain through the import bill, transport costs, utility fuel costs, industrial margins and, finally, household incomes.
- Peak-demand shock. A heatwave lasts for weeks just as transmission is delayed or the monsoon fails the hydro plants. Watch regional peak deficits, outage hours, transformer loading and the output of energy-intensive industries.
- Industrial scaling. Suppose India does build far more metals, chemicals, electronics, cooling and logistics. Work out the generation, hourly demand, network capacity, capital spending and delivered energy cost from the physical output itself, not from a convenient GDP rule of thumb.
The Constraint Is Also the Investment Opportunity
Let me be precise about the claim. I am not saying energy alone makes great powers, and I am not saying India must consume like America. I am saying that any serious industrial or geopolitical ambition has to be matched by energy services of the right scale, reliability, cost and security. Energy sets the limits; institutions and choices determine what India can do.
Put the four strands together and they make one case. India has scale, but not depth per person. It has supply, but not always reliability. It builds generation faster than the wires that deliver it. And it imports nearly nine-tenths of its crude oil.
India's next energy investment cycle will depend as much on how well India uses the grid it already has as on how much new capacity it builds. India has made real progress in electricity generation, access and the reduction of national shortages. Yet four things still limit how much of that energy becomes output: transmission and distribution losses, uneven reliability, financially weak utilities and dependence on imported fuels.
Those limits create three investment opportunities, in sequence. Each has different winners, risks and timelines.
The first is building and repairing the grid. India must simultaneously add transmission capacity, modernise distribution networks, replace ageing equipment, improve metering and integrate new generating and storage capacity. That means years of demand for transformers, cables, substations and the engineers who build them. But big spending does not automatically mean good returns for shareholders. Equipment manufacturers with technological advantages, pricing power and manufacturing capacity may capture much of the value. Contractors exposed to competitive pricing, delayed collections and working-capital pressure may grow revenue fast without generating the cash to match.
The second comes from the grid’s failures. Industrial customers require electricity that is available at the right time, voltage and cost. Where public distribution networks cannot provide it, businesses invest in captive generation, private electricity procurement, storage, backup systems, power conditioning and energy efficiency. Each adds to production costs, but creates a market for companies that sell reliability or cut energy use. Paradoxically, a weak grid helps these businesses grow even as it holds back the wider economy. How long that lasts depends on how fast the public grid improves.
The third, and potentially the largest, is industrial productivity. As electricity delivery becomes more reliable and cheaper, factories can reduce backup costs, avoid production interruptions, increase utilisation, automate processes and expand capacity. The gain matters most in energy-intensive and continuous-process industries. In the infrastructure cycle, the first gains go to equipment suppliers and contractors; in this phase, value moves to manufacturers and, in the end, their customers. It may also do the most for the wider economy, through additional manufacturing investment, employment, exports and domestic demand.
None of this happens automatically, or evenly. India’s distribution companies still serve conflicting political and commercial goals. Tariff restrictions, cross-subsidies, delayed payments and inadequate collections drain utility finances and squeeze maintenance and investment. And as more industrial customers find other sources of power, they may leave the weakest distribution companies behind. Without financial reform, the system risks repeating its own failures.
Four broad outcomes are possible. Coordinated financial reform and infrastructure investment could unlock large productivity gains in industry. Infrastructure expansion without financial reform could produce strong equipment demand but disappointing system-wide returns. Financial improvement without timely physical delivery could strengthen utility balance sheets while leaving industrial bottlenecks unresolved. Failure on both fronts could leave India with islands of industry running on reliable private power, surrounded by regions left behind. India could see all four at once, in different states and industrial clusters, which is why national averages mislead.
Energy security compounds the uncertainty. India's dependence on imported crude oil leaves its economy exposed to global prices, maritime disruptions and currency movements. A lasting price shock could at once raise industrial costs, intensify inflationary pressure and increase the cost of financing the infrastructure needed to improve energy security. But the same exposure strengthens the economic case for efficiency, diversification and technologies that deliver more useful work from each unit of energy.
So, for investors: spending is not value, and value is not returns. Keep the three apart. Ask four questions: which constraint a business addresses, how much value removing it creates, who has the bargaining power to capture that value, and whether the resulting cash flows justify the capital committed and the valuation paid.
Track the evidence at three levels: infrastructure commissioning and reliability; utility finances and cash collections; and effective energy cost per unit of saleable industrial output. The last matters most. Without comparable factory-level data on electricity bills, interruptions, backup generation, power quality and lost production, nobody can pin down the size of India’s industrial energy disadvantage.
Four published numbers will show which way it is going:
- AT&C losses, 15.04% in FY2024–25, and whether RDSS works are built, not just sanctioned;
- the share of distribution transformers with a meter, 44.2% in March 2026;
- outage hours and captive generation in India’s industrial clusters, not just at Mundra; and
- crude import dependence, 88.2% in FY2024–25.
Put it all together and the argument is one chain. Energy that arrives reliably and cheaply lets factories run full. Factories that run full make Indian industry competitive. Competitive industry draws the capital that builds national strength. And a country that wastes less energy and imports less oil has more room to use that strength as it chooses. Every link in that chain is also an investment: in the grid that delivers the energy, in the businesses that make it dependable, and in the manufacturers that turn it into output. India’s foreign minister called it a power in the middle. It will rise above the middle when what flows through its wires, pipelines and ports is as dependable as its ambitions. That is the constraint to respect, and the opportunity to own.
References
- R1Vaclav Smil, Energy and Civilization: A History (MIT Press, 2017); and author’s Energy and National Development research note, pp. 1–9.
- R2UNDP, Human Development Report 2023/2025 indicators; author’s energy–HDI comparison, note pp. 4–5.
- R3Robert U. Ayres and Benjamin Warr, The Economic Growth Engine (Edward Elgar, 2009).
- R4Energy Institute, Statistical Review of World Energy 2025; 2024 supply and electricity series. https://assets.kpmg.com/content/dam/kpmgsites/sk/pdf/2025/Statistical-Review-of-World-Energy.pdf.coredownload.inline.pdf
- R5World Bank World Development Indicators, GDP per capita PPP (NY.GDP.PCAP.PP.CD), via UNdata. https://data.un.org/Explorer.aspx?d=WDI
- R6World Steel Association, World Steel in Figures 2026. https://worldsteel.org/data/world-steel-in-figures/world-steel-in-figures-2026/
- R7World Bank, Doing Business 2020, India economy profile (Getting Electricity: Delhi/Mumbai SAIDI and SAIFI). https://www.worldbank.org/content/dam/doingBusiness/country/i/india/IND.pdf
- R8World Bank Enterprise Surveys, IC.ELC.OUTG.ZS, latest surveys by country. https://data.worldbank.org/indicator/IC.ELC.OUTG.ZS
- R9Ministry of Power, Lok Sabha reply, 5 February 2026, national energy shortages and peak demand. https://www.pib.gov.in/PressReleseDetailm.aspx?PRID=2223710&lang=2®=48
- R10World Bank WDI, EG.ELC.LOSS.ZS, electric power T&D losses. https://data.worldbank.org/indicator/EG.ELC.LOSS.ZS
- R11Ministry of Power, 12 February 2026, state-wise AT&C losses. https://policyindex.ai/in/gazette/parliament-question-aggregate-technical-and-commercial-losses-ihy0gg
- R12Government of India/PIB, 2026 power sector progress, electricity use and supply hours. https://www.pib.gov.in/PressNoteDetails.aspx?ModuleId=3&NoteId=157872&lang=1®=3
- R13CEEW, Anatomy of Distribution Losses in India’s Power Sector: Findings from a Feeder-level Study in Uttar Pradesh, 19 January 2026. https://www.ceew.in/publications/understanding-electricity-feeder-distribution-systems-in-power-sector
- R14E. A. Wrigley, Energy and the English Industrial Revolution (2010), historical conceptual reference.
- R15US EIA, national history and energy consumption,. https://www.eia.gov/
- R16Blair Fix, The Half Life of Empire (Economics from the Top Down, economicsfromthetopdown.com). Source for national shares of world energy consumption as a gauge of material weight, the energy-share peaks and “half life” periods for Britain (c. 1850–1952) and the United States (1889–2008), the China–US crossover in 2009, and the curves digitised in Figure 1; author’s historical curve reconstruction.
- R17Energy for Growth Hub infographic, citing US EIA and World Bank (2021);.
- R18IEA, Electricity 2026, Prices: final electricity prices for energy-intensive industrial customers. https://www.iea.org/reports/electricity-2026/prices
- R19GlobalPetrolPrices business-electricity price comparative tariff dataset; country tariff dates and definitions vary across the source set.
- R20Government of India, Lok Sabha question 4563 (19 March 2026), crude import dependence. https://sansad.in/getFile/loksabhaquestions/annex/187/AU4563_PQuxZl.pdf?source=pqals
- R21US EIA, China crude imports in 2024, 11 February 2025. https://www.eia.gov/todayinenergy/detail.php?id=64544
- R22US EIA, US net energy exports in 2024, 20 June 2025. https://www.eia.gov/Todayinenergy/detail.php?id=65524
- R23Japan Agency for Natural Resources and Energy, Japan Energy 2025. https://www.enecho.meti.go.jp/en/category/brochures/pdf/japan_energy_2025.pdf
- R24IEA, World Energy Investment 2025: India. https://www.iea.org/reports/world-energy-investment-2025/india
- R25Ministry of Power, RDSS investment approvals, Lok Sabha reply 30 July 2026. https://policyindex.ai/in/gazette/parliament-question-reduction-in-transmission-and-distribution-losses-bji00d
- R26CEA, Tariff and Duty of Electricity Supply in India, March 2026. https://cea.nic.in/reports/dashboardView?headingId=107&lang=en&subHeadingId=1001&subSubHeadingId=10008&title=Tariff+%26+Duty+of+electricity+supply+in+India
- R27Jean-Baptiste Fressoz, More and More and More: An All-Consuming History of Energy (2024), energy accumulation thesis.
- R28Ministry of Power, Assessments on Adequacy of Transmission and Distribution Infrastructure, parliamentary response, 30 July 2026 (Press Information Bureau).
- R29REC Limited, Consumer Service Rating of DISCOMs FY2024–25, Section 2.2.5 (distribution transformer failure rates).
- R30CEA, Report on Status of Metering, as of 31 March 2026 (August 2026); CEA, General Review 2025 (distribution transformer counts, March 2024).
- R31Matched-factory energy economics model (India, China, Vietnam, Germany, USA), November 2026 model: IEA 2025 large-industry price estimates; Adani Energy Solutions (Mundra), China NEA, EVN, Bundesnetzagentur and US EIA reliability data; World Bank Enterprise Surveys IC.ELC.GENR.ZS; process SEC from BEE, IFC and sector sources. Stylised plant models, not observed factory accounts.
- R32CEA, captive power generation by industry, FY2023–24 (Table 5.5; industrial captive plants with demand ≥0.5 MW).